I’m relearning GIS after a ten year gap and, just like when I first learnt it, it’s doing things randomly that I can’t solve. Google hasn’t thrown up any answers. I’m trying to do some interpolation in QGIS 3.1- I did it yesterday following the instructions in this video –
Now, two days later, it won’t play ball. I do the interpolation and either there’s no output or a single colour output using an average value of the data I’m interpolating between.
Here’s what I’m doing-
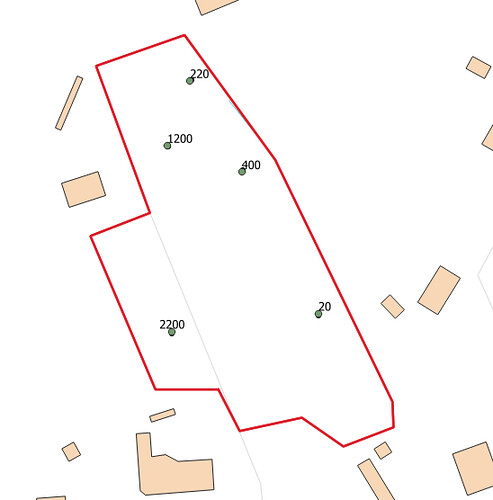
1- I have five data points showing levels of an element in groundwater. I want an interpolation between them.
[url=https://flic.kr/p/2id1q14]1[/url] by Luke Bradley, on Flickr
2- Here’s the attribute table for the field-
[url=https://flic.kr/p/2id2tYd]2[/url] by Luke Bradley, on Flickr
3- Here’s what I’ve put into the IDW Interpolation box-
[url=https://flic.kr/p/2icY3nk]3[/url] by Luke Bradley, on Flickr
4 – The output interpolation layer only has a single value. Changing this value in the Style dialog box doesn’t do anything – the interpolation visualisation doesn’t display.
[url=https://flic.kr/p/2icY3mP]4[/url] by Luke Bradley, on Flickr
5 – Here’s what my map looks like after I’ve run the interpolation. Nothing.
[url=https://flic.kr/p/2icY3md]5[/url] by Luke Bradley, on Flickr
If I run it using Layer Extent as the area – a black square (using singleband grey for the style) –
[url=https://flic.kr/p/2id2FgP]6[/url] by Luke Bradley, on Flickr
What am I doing wrong? I’ve not changed anything from when I ran this on Wednesday and got a lovely colourful display using singleband pseudocolour.