
MegaSack DRAW - This year's winner is user - rgwb
We will be in touch
😉
Are there any online tools akin to prezi or wordle that allow me to draw decent looking charts? Excel is doing my nut with its dullness
this one looks nice;
[img]  [/img]
could you use that?
Can I be the first to say....
[img]  [/img]
Edit: I was too busy looking at how tasty it seemed.
wwwas, probably.
[img]  [/img]
Cougar you beat me to it by 56 seconds!!
I beat you all to that by 27 minutes to be fair 😉
I'm just too subtle fo ya.
Anything you want to know about pie is [url= http://www.weebls-stuff.com/wab/pie/ ]Here[/url]
I got the (original) reference don't worry, it wasn't in vain.
Yes, that was the joke of the thread title and the reason it started with a smiley and now the 3rd time it's been linked. Clearly too subtle OP 🙂
to be fair though, this is about as productive as all the team meetings we have here about this kind of thing
in my defence I did get the original joke hence me posting a pie chart that was useless for the purpose you wanted to use it for.
Go and read some data visualisation literature and flog yourself for even considering using a pie chart.
(the human mind is terrible at comparing areas, almost any pie is going to be better represented by a bar chart)
titusrider - Member
Go and read some data visualisation literature and flog yourself for even considering using a pie chart.(the human mind is terrible at comparing areas, almost any pie is going to be better represented by a bar chart)
You are Sheldon Cooper and I claim my £5
Has maybe been watching too much big bang theory recently.....
(and design and build reporting for a living)
no time for all that bobbins. Can you do it for me?
Pook - Memberno time for all that bobbins. Can you do it for me?
[IMG]
 [/IMG]
the human mind is terrible at comparing areas
But pie charts could also be considered to be comparing angles, no?
😀
[img]  [/img]
[i]the human mind is terrible at comparing areas[/i]
give my kids a slice of cake and say "One cuts and the other chooses" and the cutter will be molecule accurate in splitting it in two.
[url] http://www.perceptualedge.com/articles/08-21-07.pdf [/url]
We make angle judgments when we read a pie chart, but we don’t judge angles very
well. These judgments are biased; we underestimate acute angles (angles less than
90°) and overestimate obtuse angles (angles greater than 90°). Also, angles with
horizontal bisectors (when the line dividing the angle in two is horizontal) appear
larger than angles with vertical bisectors. (Naomi Robbins, Creating More Effective
Graphs, Wiley, 2005, p. 49)
once they are old enough to wield knives without hacking each others ears off our gouging their own eyes out I shall be using this method.give my kids a slice of cake and say "One cuts and the other chooses" and the cutter will be molecule accurate in splitting it in two.
give my kids a slice of cake and say "One cuts and the other chooses" and the cutter will be molecule accurate in splitting it in two.
I do this too, it's ace
here's another one for you [img] 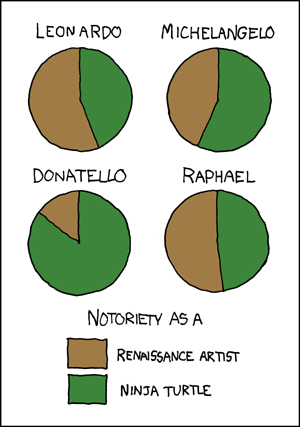 [/img]
well this hasn't worked.
titusrider - MemberHas maybe been watching too much big bang theory recently.....
Have you found a 25th hour in the day, otherwise there's no such thing!
Pook in all seriousness, keep the charts 'dull' and let the data do the talking.
Flashy looking charting with 3d affects, colors etc rings lots of alarm bells in my head
Excel is actually pretty good at this, aim for a nice [url= http://www.infovis-wiki.net/index.php/Data-Ink_Ratio ]Data ink Ratio[/url]
.
Peters every time