we know three points on it.
No. We know that the Laffer theory posits them. In fact we know absolutely nothing beyond that. And every attempt to quantify those points has failed. That's the trouble with theories - if you can't test them they are useless and the Laffer curve theory has failed pretty much every test anyone has thrown at it.
This has nothing to do with elasticity or lack of it. You can create elasticity where none exists. In your building example, you can't move the building but you can surely move the money.
Taxes are also used to change behaviour, and they are pretty good at it, within limits. If you go too far the pips don't squeek, they just go shopping on the continent, creating elasticity.
The Laffer curve posits that at 92% marginal top rate of income tax, income tax revenues should have fallen noticeably. They didn't. It posits that at 28%, income tax revenue should have risen. Didn't happen. More recent work suggests that a top rate in the 75% range should be optimal, the Laffer curve posits that isn't true.
Almost everything is true at the margins, trouble is the world doesn't work there.
I’m fighting the temptation to go and campaign for the brexit party, as round here the incumbent tory has a massive majority. Would be nice to stuff that up
Go for it regardless of Tory massive majority. Even reducing their majority is a good sign for future elections to come.
So, the Leaders election debate on ITV will between the leaders of two pro-Brexit parties?
You sound surprised? Neither would agree to anything else, would they? I wouldn’t in their shoes. Not saying it’s good, just inevitable.
we know three points on it.
No. We know that the Laffer theory posits them.
Wrong.
Imagine a cheese tax.
We know that a tax rate of 0 on cheese raises zero revenue.
We know the revenue we get form the cheese tax today. So we know that point.
And we know there's a point at the top end where cheese will become un-affordable and revenue will drop again to zero.
Those aren't fictional, they're not laffer theory they're cast iron data points.
If we change the cheese tax a couple of times we very soon learn a few more data points.
The Laffer curve posits that at 92% marginal top rate of income tax
No it doesn't. The laffer curve is just a way to represent your data. If you know revenue at a point you know it. If you don't know it you're guessing. That's nothing to do with laffer curves.
income tax revenues should have fallen noticeably. They didn’t
So there's two solid data points right there that are known. (At that date in that economy.) So we're up to five already. And that's how it works, it's never going to be perfect, but there's nothing better.
Essentially your argument isn't with plotting the data on a chart you're saying that we don't know a large chunk of the data. Which is true as far as it goes but we accept that you can find the sweet spot on a demand/supply curve for mars bars in which case you can get a good curve for tax on mars bars. If the Laffer curve is "bollocks" or "debunked" than so are supply/demand curves. I'm willing to bet that not one of us would expect to charge a lot more or a lot less for the product we make our living at at and make significantly more.
If we change the cheese tax a couple of times we very soon learn a few more data points.
Only all other things being equal - like for example a changing economy meaning people cannot afford cheese, or a health scandal, or even supply problems caused by cow shortages.
Maybe the NYTimes just has a problem with Laffer
Well the NYT is just wrong. They're saying there is no point where revenue decreases if you increase tax. But we know there must be a point. How could there not be? If you put a cucumber tax of "all the money in the world" on a cucumber you can be *pretty* sure zero cucumbers will be bought and revenue will be zero. If you put a tax of all the money in the world +£1on cucumbers you know for certain none will sell and revenue will be zero. So there *must* be a point where revenue goes down when you increase tax and with a bit of trial and error you have a shrewd idea where it is.
Only all other things being equal – like for example a changing economy meaning people cannot afford cheese, or a health scandal, or even supply problems caused by cow shortages.
Yup, I'm sure it's fiendishly difficult but using the best data you can is the best you can do. You certainly can't discount the data completely because it's imperfect.
(...and I thought I had all that covered with "At that date in that economy.")
Guardian I think it was reporting that the Commons committee report on Russian interference is being delayed. That might liven things up if it's released before 12th December 🤔
You sound surprised? Neither would agree to anything else, would they? I wouldn’t in their shoes. Not saying it’s good, just inevitable.
This. Debating with the others doesn't benefit them at all.
I'm amazed Boris, as incumbent, agreed to debate at all but I guess he had little option.
Boris and Corbyn have got similar aims in this election. They both want Brexit not to be an issue (good luck chaps) and they both wish the BP and Libdems would go away. I don't think either will happen.
Re the Laffer curve/Laffer point, I think it's pretty informative that practically everyone that mentions it, does so as part of an argument against raising taxes *at all*. Very rarely do people mention it as a tool to maximise tax revenue, except incidentally. Regardless of the efficacy of the actual theory, in practice it's become no more than dogma.
I propose we develop the Laffer Curve Curve- plotting the probability that any pundit, politician or economist STW poster who mentions it, will simultaneously argue that we are already at or past that point and that all future tax rises should be avoided.
Commons committee report on Russian interference is being delayed. That might liven things up if it’s released before 12th December 🤔
When do the EHRC report?
I think it’s pretty informative that practically everyone that mentions it, does so as part of an argument against raising taxes *at all*. Very rarely do people mention it as a tool to maximise tax revenue, except incidentally.
It's not a tool to argue against raising tax. It's not a tool to maximise revenue. It's just a diagram to help visualise some numbers.
I find it very hard to believe that the people who decide our tax rates *don't* consider revenue and they can't do that without looking that the numbers/predictions they have. (No matter how imperfect.)
In fact (rightly or wrongly) I imagine the minister sitting there with the Sir Humphrey figure and the Sir Humphrey figure patiently explaining why the minister can't make lower a value because it will cost X or gets no benefit from raising a value because it's just not worth the political cost for such a small gain.
Again think of the things that are taxed highly, I can't believe that whoever decided to tax petrol at 75% wasn't well aware that demand for petrol is inelastic. Or business rates, the reason they're sky high is because they're difficult to avoid and therefore in-elastic. It seems pretty clear to me that they work out predicted revenue for everything, stuff they're taxing at a high level or not. Every tax decision must be a balance between revenue raised and political gain.
If you were a Treasury Civil Servant and the Minister said "I've got a great idea, let's lower Business rates, that'll be *really* politically popular" wouldn't you be reaching for a chart out to show him just how much cash he'd be losing? ...and when he saw that chart wouldn't he go a bit pale and change his mind?
Facts are just facts.
Regardless of the efficacy of the actual theory, in practice it’s become no more than dogma.
Great, what's the alternative way to predict/record revenue for a specific tax at a specific rate? We'll use that instead in future.
outofbreath
Member
It’s not a tool to argue against raising tax
Laffer literally sat down at a table with Dick Cheney and drew the curve on a napkin to argue against Ford's tax raises- from day 1 he argued that the USA was already in the prohibitive side of the curve. It directly informed Reagan's disastrous tax cuts. Laffer personally worked on the Kansas experiment, where as ever he argued that taxes were in the prohibitive side, which was another incredible failure.
It has always been, and was always intended to be, an argument against raising tax- dedicated to Donald Rumsfeld.
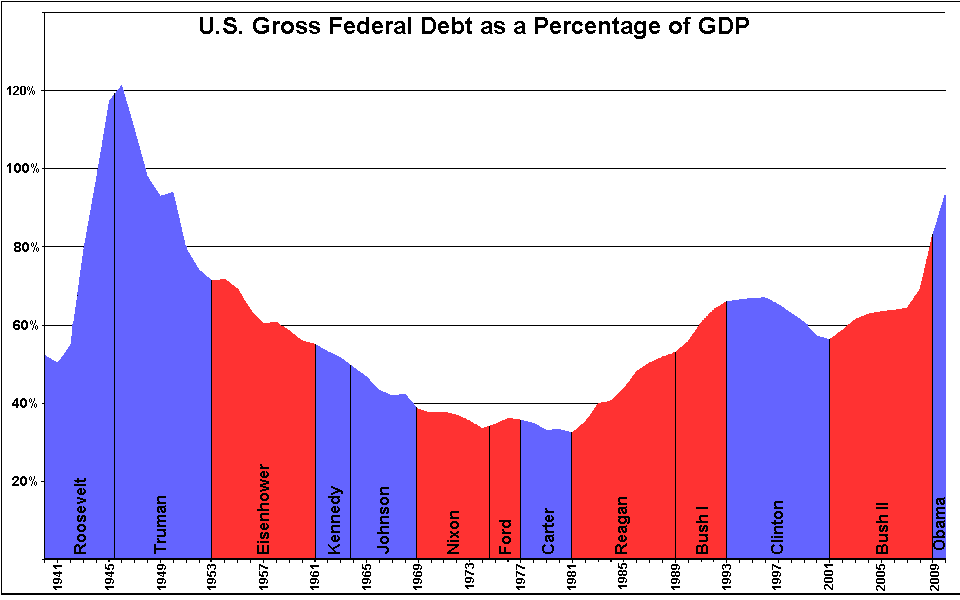
Facts are just facts. Here's the real Laffer Curve
It has always been, and was always intended to be, an argument against raising tax
Fine. So what's the better alternative? We'll use that instead.
Or are you saying it's wrong to consider revenue at all when deciding tax rates?
Plus, I'm not sure I even believe you. People were looking for in-elastic stuff to tax in medieval times. How the hell could Laffer be the first person to have considered the impact on revenue a tax has when revenue is the primary reason for tax by a country miles. They must have been having a guess at the numbers even if they chose a different way to visualise them.
EDIT: I googled. You're wrong. "The basic concept was not new; Laffer himself notes antecedents in the writings of the 14th-century social philosopher Ibn Khaldun and others." https://en.wikipedia.org/wiki/Laffer_curve
outofbreath
Member
Plus, I’m not sure I even believe you
Facts are just facts.

Paul Ryan has another Laffer napkin dedicated to him in his office.
outofbreath
Member
Or are you saying it’s wrong to consider revenue at all when deciding tax rates?
Not even slightly. Understand this; the Laffer curve isn't criticised because of the underlying principle, which is absolutely sound and rational; it's criticised for 2 reasons. The first is that it takes a very complicated relationship and reduces it to a level of simplicity such that it's no longer meaningful.
The other, is that it was invented as a tool to argue for tax cuts, literally as a response to, and dedicated in writing to, politicians who wanted to cut taxes but couldn't come up with a sellable argument. Laffer's enthusiasts never see a tax rate that shouldn't be lower. Every time Laffer has been directly involved in taxation, he's confidently predicted that the tax in particular is prescriptive, and every time he has been proven wrong. Catastrophically wrong, in the case of Kansas.
It's not economics; it's politics dressed as economics.
Here’s the real Laffer Curve
No it isn't it's a chart of debt as a percentage of GDP. A laffer curve, is a chart of revnue against unit tax level. (Or similar.)
And what do you mean by *the* laffer curve. There isn't a single laffer curve.
Anyway, I really don't care what tool we use to consider revenue. If you don't like the Laffer curve suggest something better.
Unless you're saying it's wrong to consider revenue full stop.
As I said. I googled. “The basic concept was not new; Laffer himself notes antecedents in the writings of the 14th-century social philosopher Ibn Khaldun and others.” https://en.wikipedia.org/wiki/Laffer_curve
Anyway, I really don’t care what tool we use to consider revenue. If you don’t like the Laffer curve suggest something better.
Unless you’re saying it’s wrong to consider revenue full stop.
It’s not a tool to argue against raising tax. It’s not a tool to maximise revenue. It’s just a diagram to help visualise some numbers.
It really is not. There are no numbers associated with the Laffer curve. He put percentages up one axis and a 'scale' along the other. He gave it a shape which insinuates it 'says' something and it just doesn't.
Here is what the Ladder curve tell us :. In theory, there is a point where the level of income taxation will maximise revenue for a government. Period. It does not indicate where that might be, nor can it actual take any numbers.
I am quite willing to accept that there is such a theoretical point. The problem is that in order to figure out what it is, you would have to control for a myriad of factors, Inflation, economic growth, tax loopholes and enforcement, labour and money mobility, underground markets/economy. Etc. I suspect the graph would really look like a 2 year olds drawing of a maze. So there will be no single point.
It was a hypothesis that Laffer drew without any testing or analysis whatsoever. And the only thing he was interested in was the bottom part because he as a bit of a right wing fiscal hawk Looney.
It was also only really thought of in regard to income/revenue tax, not cheese or Mars bars, because income isn't optional and has no real market replacement.
Also 100% tax would be basically communism and the government revenues would not be 0.
Here is what the Ladder curve tell us :. In theory, there is a point where the level of income taxation will maximise revenue for a government. Period. It does not indicate where that might be, nor can it actual take any numbers.
Why can't a graph of unit rate against revenue "take" any real numbers? It self evidently can.
Anyway, I really don't GAF what chart we use to consider revenue. If you don't want a graph of unit rate against revenue I'm happy to use something else. Just tell me what's better and we'll use that.
outofbreath
Member
No it isn’t it’s a chart of debt as a percentage of GDP. A laffer curve, is a chart of revnue against unit tax level. (Or similar.)
OK, you don't understand the point, I should have been clearer. The debt/GDP curve shows the laffer curve in action, because the two presidents who put his urgings into practice, are the two with the greatest rise in debt/GDP. Their cuts that were supposed to pay for themselves through growth, did not- in fact never showed even the slightest signs of it.
This isn't because the concept is unsound; it's because in both cases Laffer claimed that the tax rate was in the prescriptive side of his curve, in both cases without any evidence, and in both cases he was demonstrably wrong. As he was in Kansas. In fact, Laffer has never once in his career seen a tax rate that wasn't too high- he has always allied himself to tax-cutting politicians, and always advocated for cuts, and every time he's succeeded (which is depressingly often, because the people wanted to be convinced)- every single time, the result showed he was wrong. The cost to the people of Kansas has been appalling but that won't stop him from supporting and encouraging the next tax-slasher.
And this demonstrates the dogma that's overridden the theory.
What's better, you ask? Actual financial modelling. Applying theories and learning from previous disasters. Basing economics on maths not political opinion.
You keep asking for a tool but there's no tool that can do all of these things- and that's because it's fantastically complicated and interdependent. It's not even all economics, because so many of the conditions involved are human and psychological. Accepting that doesn't mean throwing away the desire to maximise tax; it only requires that we accept that it's bloody complicated.
But the Laffer Curve isn't a tool, it was never even an attempt to create a tool- it's an attempt to justify a belief system with a nice easy to understand drawing. It's sometimes described as a simplistic model of a complicate world but in reality it's not a model.
Also 100% tax would be basically communism and the government revenues would not be 0.
It wouldn't be 0 anyway even on income tax. *Someone* would be willing to work for nothing for some reason or other. (...and obviously a 100pc tax on cheese would just double the price of cheese which many of us would tolerate.) But yeah, there would be a point where revenue would be 0.
Another thread de-railed.
Theoretical and hypothetical economics.
Nothing much to do with forthcoming GE which is likely to be a Brexit proxy.
The laffer curve is just nonsense trotted out by the right wing to justify lowering tax. It's discredited and can not be seen anywhere
Oob is just doing this and attempting to distract from the utter mess the tories are in
And this demonstrates the dogma
Ok, so what do I use if I shouldn't be using a laffer curve.
I've got a list of historic tax rates for cheese for this year [1] and I've got a list of cheese revenue numbers. How do I describe/present them in a way that suits you?
If I want to say "64pc cheese tax give us peak revenue on the laffer curve" what terminology *should* I be using and what chart should I use to show the data graphically.
[1] Cheese has changed price 100 times from 0-100 so we have very good data for every data point.
It’s discredited and can not be seen anywhere
FINE. So what *should* be used instead. Or are you saying revenue just not a consideration in taxation policy?
A graph can. The Laffer curve can't because it is a drawing, not a graph. He didn't take numbers and make a graph out of it. He made a drawing and said it meant something. People have tried to graph a laffer curve using actual data and it quite simply doesnt work. You get an indecipherable squiggle, or a line that correlates nothing to nothing.
The first question should be - is maximising revenue a desirable goal? What are we trying to achieve? Petrol is only inelastic to a point. Everytime there is a huge spike in the price, people buy less. Maybe they still have to drive to work because they have to but the don't visit family as much, or they don't go on holiday. Carbon taxes work, even if you give all of the revenue back to the taxpayer - petrol looks expensive so people buy less but they have no less money so spend it on something else. It also helps to reduce inequality by leaving lower income families better off than before, because they tend to use less carbon producing things to begin with.
Tax can be used to change habits - tax the crap out of Mars bars and use it to subsidise apples and bikes will not generate revenue but should lower costs in the long term.
What should we be taxing? Wealth? Income? Business avoid revenue taxation by e.g selling their office tower or equipment to an offshore subsidiary and then leasing it back at a loss. The money avoids taxes and the company has a write off. If you want to stop that, maximising revenue will have to be sacrificed to earn some revenue.
Etc. Etc.
Nothing much to do with forthcoming GE which is likely to be a Brexit proxy.
100pc agree. Sorry for the de-railing. 🙁
ve got a list of historic tax rates for cheese for this year [1] and I’ve got a list of cheese revenue numbers. How do I describe/present them in a way that suits you?
If I want to say “64pc cheese tax give us peak revenue on the laffer curve” what terminology *should* I be using and what chart should I use to show the data graphically.
You could use a demand curve, or simply graph tax percentage vs revenue. The correlation will be evident.
Just say a 64% cheese tax maximises revenue. Unless you are trying to get hired by a supply side economist. Then just say Laffer, and wink.
Ok, so what do I use if I shouldn’t be using a laffer curve.
I’ve got a list of historic tax rates for cheese for this year [1] and I’ve got a list of cheese revenue numbers. How do I describe/present them in a way that suits you?
If I want to say “64pc cheese tax give us peak revenue on the laffer curve” what terminology *should* I be using and what chart should I use to show the data graphically.
A graph can.
John 11:35.
So this whole argument has been that people don't think a line on a chart of revenue against unit tax level should be called a Laffer Curve.
You have no problem with data based decision, or the line being drawn form the data or the concept of working out revenue, you just prefer it to be described as "a graph" rather than a Laffer Curve. ...and that was worth an evening of our lives wasted squabbling.
I shall henceforth refer to the hypothetical Laffer Curve as Laffer Curve and specific instances of it as 'A line on a graph' and we'll all be happy.
Just say a 64% cheese tax maximises revenue.
Trust me I will. After tonight I will never say "64pc is the sweet spot on on Laffer Curve". It's not worth a whole wasted Friday night.
Nothing much to do with forthcoming GE which is likely to be a Brexit proxy.
Dunno. The whole Brexit thing seems to based on a whole lot of hypothetical economic BS and voodoo. If voters had been a bit more open to actual economic facts and less inclined to believe ideological driven economic drivel, we might not even be having this election.
If they genuinely fought this GE on the basis that it is a Brexit proxy and judged that on facts I doubt the polls would be predicting what they are.
You have no problem with data based decision, or the line being drawn form the data or the concept of working out revenue, you just prefer it to be described as “a graph” r
No, I absolutely want this. More of it, whenever possible, data driven decision making. Yes. Please.
I don't really care what you call the Laffer curve as long as it includes BS, bunk, junk science, discredited and wrong. Not a graph, a drawing with no artistic value. A veritable economic BoJo.
No, I absolutely want this. More of it, whenever possible, data driven decision making. Yes. Please.
Me too & we're 100pc happy with me picking 64pc on my "cheese tax revenue graph" which I will not refer to as the sweet spot on the laffer curve. I could even pick 34pc or 84pc on the graph[1] for political reasons and take the revenue hit.
I'm cool with that. I really don't care about terminology.
Life is sweet.
[1] Which is not a laffer curve. Absolutely not.
EDIT: Hilariously 12 hours ago I said this:
If working out the highest revenue base on the laffer curve is wrong, what mechanism *should* be used to calculate optimum tax take? I’m all ears because AFAICT anything you can suggest will just be the laffer curve with a different name!
..and 12 hours later it's ended with us literally agreeing that we're all ok with using the laffer curve, just with a different name. 😀
graph[1]
[1] Which is not a laffer curve. Absolutely not.
..and 12 hours later it’s ended with us literally agreeing that we’re all ok with using the laffer curve, just with a different name
See now I thought you'd go it and then you put words in my mouth. A graph is a picture made by plotting data points. The shape can usually be described by a formula.
A laffer curve is a doodle on a napkin with no connection to data whatsoever.
Not a different name - an entirely different thing.
YAWN.
Have not heard any reference to Laffer from any of the many politicos who have been spraying their bullshit all over the media.
You two - oob & chromy - are in your personal echo chamber.
You're welcome.
outofbreath
Member
So this whole argument has been that people don’t think a line on a chart of revenue against unit tax level should be called a Laffer Curve.
No. The argument has been that the Laffer Curve is not a chart of revenue against unit tax level.If you were to chart revenue against unit tax level, you wouldn't get a Laffer Curve- you'd get a Nonlafferian Squiggle With Weird Bits.
Put it a different way- they didn't take that revenue chart and attach the name "Laffer Curve" to it- they're two distinct and different things.
You're attached to your cheese tax but really, that's the extent of oversimplification you have to go to before the Laffer Curve gets close to reality, and even then it fails- the real world numbers wouldn't yield anything like his curve
But it was invented specifically in reaction to Gerald Ford's proposed 5% increases on corporation tax, and income tax for individuals earning over $150000 per year (at the time, equivalent to 14 times the average household income- so equivalent to $8250000 today) How closely do you think economic behaviour in those 2 categories resembles your cheese tax?
(there's a distinction here that I think you might not have appreciated; just as the Laffer Curve doesn't map the actual relationship between taxation and revenue, the concept of that a tax raise will not always lead to a tax income increase is not the same as the Laffer Curve. The Laffer Curve is an attempt to take that concept and force it into a convenient shape, without regards to the actual numbers. Dismissing the Laffer Curve doesn't mean throwing away the concept that was its springboard, it only means accepting that this specific rendition of that concept doesn't work. You've conflated the two a fair bit in your posts.)
Where I started with this was pointing out that it's always been a tool to promote tax cuts. The history proves that's the case, but if you do still doubt it- can you find a single case where anyone in a position of power has invoked the Laffer Curve to argue for a tax hike? And can you find a single case where Laffer or his disciples looked at a tax rate and decided that actually, it was too low? For that matter, can you find any case where Laffer recommended a tax cut, it was applied, and revenues increased?
Reaganomics and the Kansas experiment are spectacular examples of the opposite, and Trump's tax cuts are going to be the example people point at in 10 years if this thread's still running, but where are Laffer's victories?
(he probably considers the Kansas experiment a victory tbh; it didn't work out according to his theory, and it did enormous harm to the economy and the people of Kansas... but it did result in a tax cut for rich people, which is exactly where he came in)
Always thought it was called the Smiley Curve for EQing Hi-Fi audio so that it sounded nice.
Then there's the bathtub for manufactured products reliability 🙂
The argument has been that the Laffer Curve is not a chart of revenue against unit tax level.
Yes it is. X axis is rate of a given tax. Y axis is revenue at that rate.
Anyway it doesn't matter because we're all happy now. You're happy because I'm not calling a graph of rate against revenue a laffer curve and I'm happy because I have way of calculating/saying what I want to describe that meets with your approval which is *very* important to me.
outofbreath
Member
Yes it is. X axis is rate of a given tax. Y axis is revenue at that rate.
No, it isn't. That's the entire point. If you did plot those numbers, you don't get the Laffer Curve- you get a chart of tax and revenue. They are not the same thing. It's not about the name, it's about what these two different things are
I think maybe this entire argument/conversation, is because of this misunderstanding? Laffer wasn't modelling anything, he wasn't charting anything. It's not a name for a chart of tax and revenue, it's a statement of what he thinks that chart looks like, without evidence.
So, I say the Laffer Curve was invented in 1974. As you say, the concept was much older, Laffer says the same. He didn't invent the concept, he invented this particular interpretation to make an argument for tax cuts.
So, your cheese tax. Actual economics would be based on researching or modelling the figures and drawing that chart of cheese tax and cheese tax revenue. That's fine, but it's not a Laffer Curve. The Laffer Cheese Curve would be based on drawing a line on a napkin, to support your personal belief that the cheese tax is too high, and also you're doing it for a cheese maker. If they're the same, it's by miraculous coincidence.
Your understanding of the concepts is absolutely spot on but your understanding of the Laffer Curve itself isn't. And I think that's because you're a rational person, and you expect people to act based on numbers and evidence, and it just doesn't really make any sense that presidents act on an economic theory that isn't, and that has never delivered on its claims
It's not about my approval- it really is just about the reality of it. The Laffer Curve isn't what you think it is. It's why trying to work out where the best crossover of tax and revenue is, based on facts, is a good idea- but letting Art Laffer do it for you is an awful idea.
The Laffer Curve posits that revenue and tax rate are related in a particular way… to say the Laffer Curve was nonsense dreamt up to support a political objective isn’t to claim that revenue and tax rate are not related at all, or to claim raising tax rates can reduce the revenue generated. No one has ever plotted tax rate against revenue using real figures and produced a Laffer Curve… most attempts show jumps, thresholds and regions of little change… which is as you’d expect given the existence of competitors for investment and retail for whatever you choose to investigate, and that, you’re measuring the effect of two different things… the elasticity of both those buying or investing, and those producing or selling.
See, that explains in one post what I've spent 2 pages failing to get across 🙂
I tried very hard not to use the word elasticity to keep it as simple as possible. But failed. The important thing was that Laffer was suggesting a simple relationship that suited his ends, and that he just pulled of his arse. Of course tax revenue changes as the tax rate changes, and tax rate increases can map to revenue reduction, but they don’t do so in a way that forms a Laffer Curve.
A quick addition; in the UK, timing matters. Revenue often increases between the announcement or suggestion of an increase on the way, and its introduction. It’s also why reductions aren’t normally signposted by the treasury, because if they are, they result in a decrease in revenue before they are introduced. But this can mess your lovely little simple graphs up, because the knowledge or expectation of a tax change can mean that the effect of that change on revenue can be more keenly felt before it happens. For example, if comparing revenue for a tax and the tax rate, both over the same time period, there can be a rise in tax revenue before a tax rise, and a fall after it… this can be interpreted by some to mean that the tax rise reduced revenue, where as what it has really done is bring some of the revenue in earlier.
Shall we start another thread on the election and leave this one to the armchair economists?