This is ace.
700 miles of BWs/By in Notts.
Always knew there were loads here.
Lincolnshire high too.
Wow, shocking that Easy Sussex, which is quite rural, only has 54 miles of bridleway, Kent 84 and West Sussex marginally better at 112.
That's shockingly crap for such a large chunk of rural SE England.
Not sure this is correct considering Derbyshire has High Peak Trail, Tissington Trail, Monsal Trail, Manifold Trail (part of!), Cromford Canal, Carsington Water etc. Plus the many 'proper' bridleways that criss-cross the county. Seems on the low side to me.

Muffin Man, Peak District's RoW are only 11% bridleways. 11% below the national average of 22%.
We are woefully served.
Staffordshire 167miles
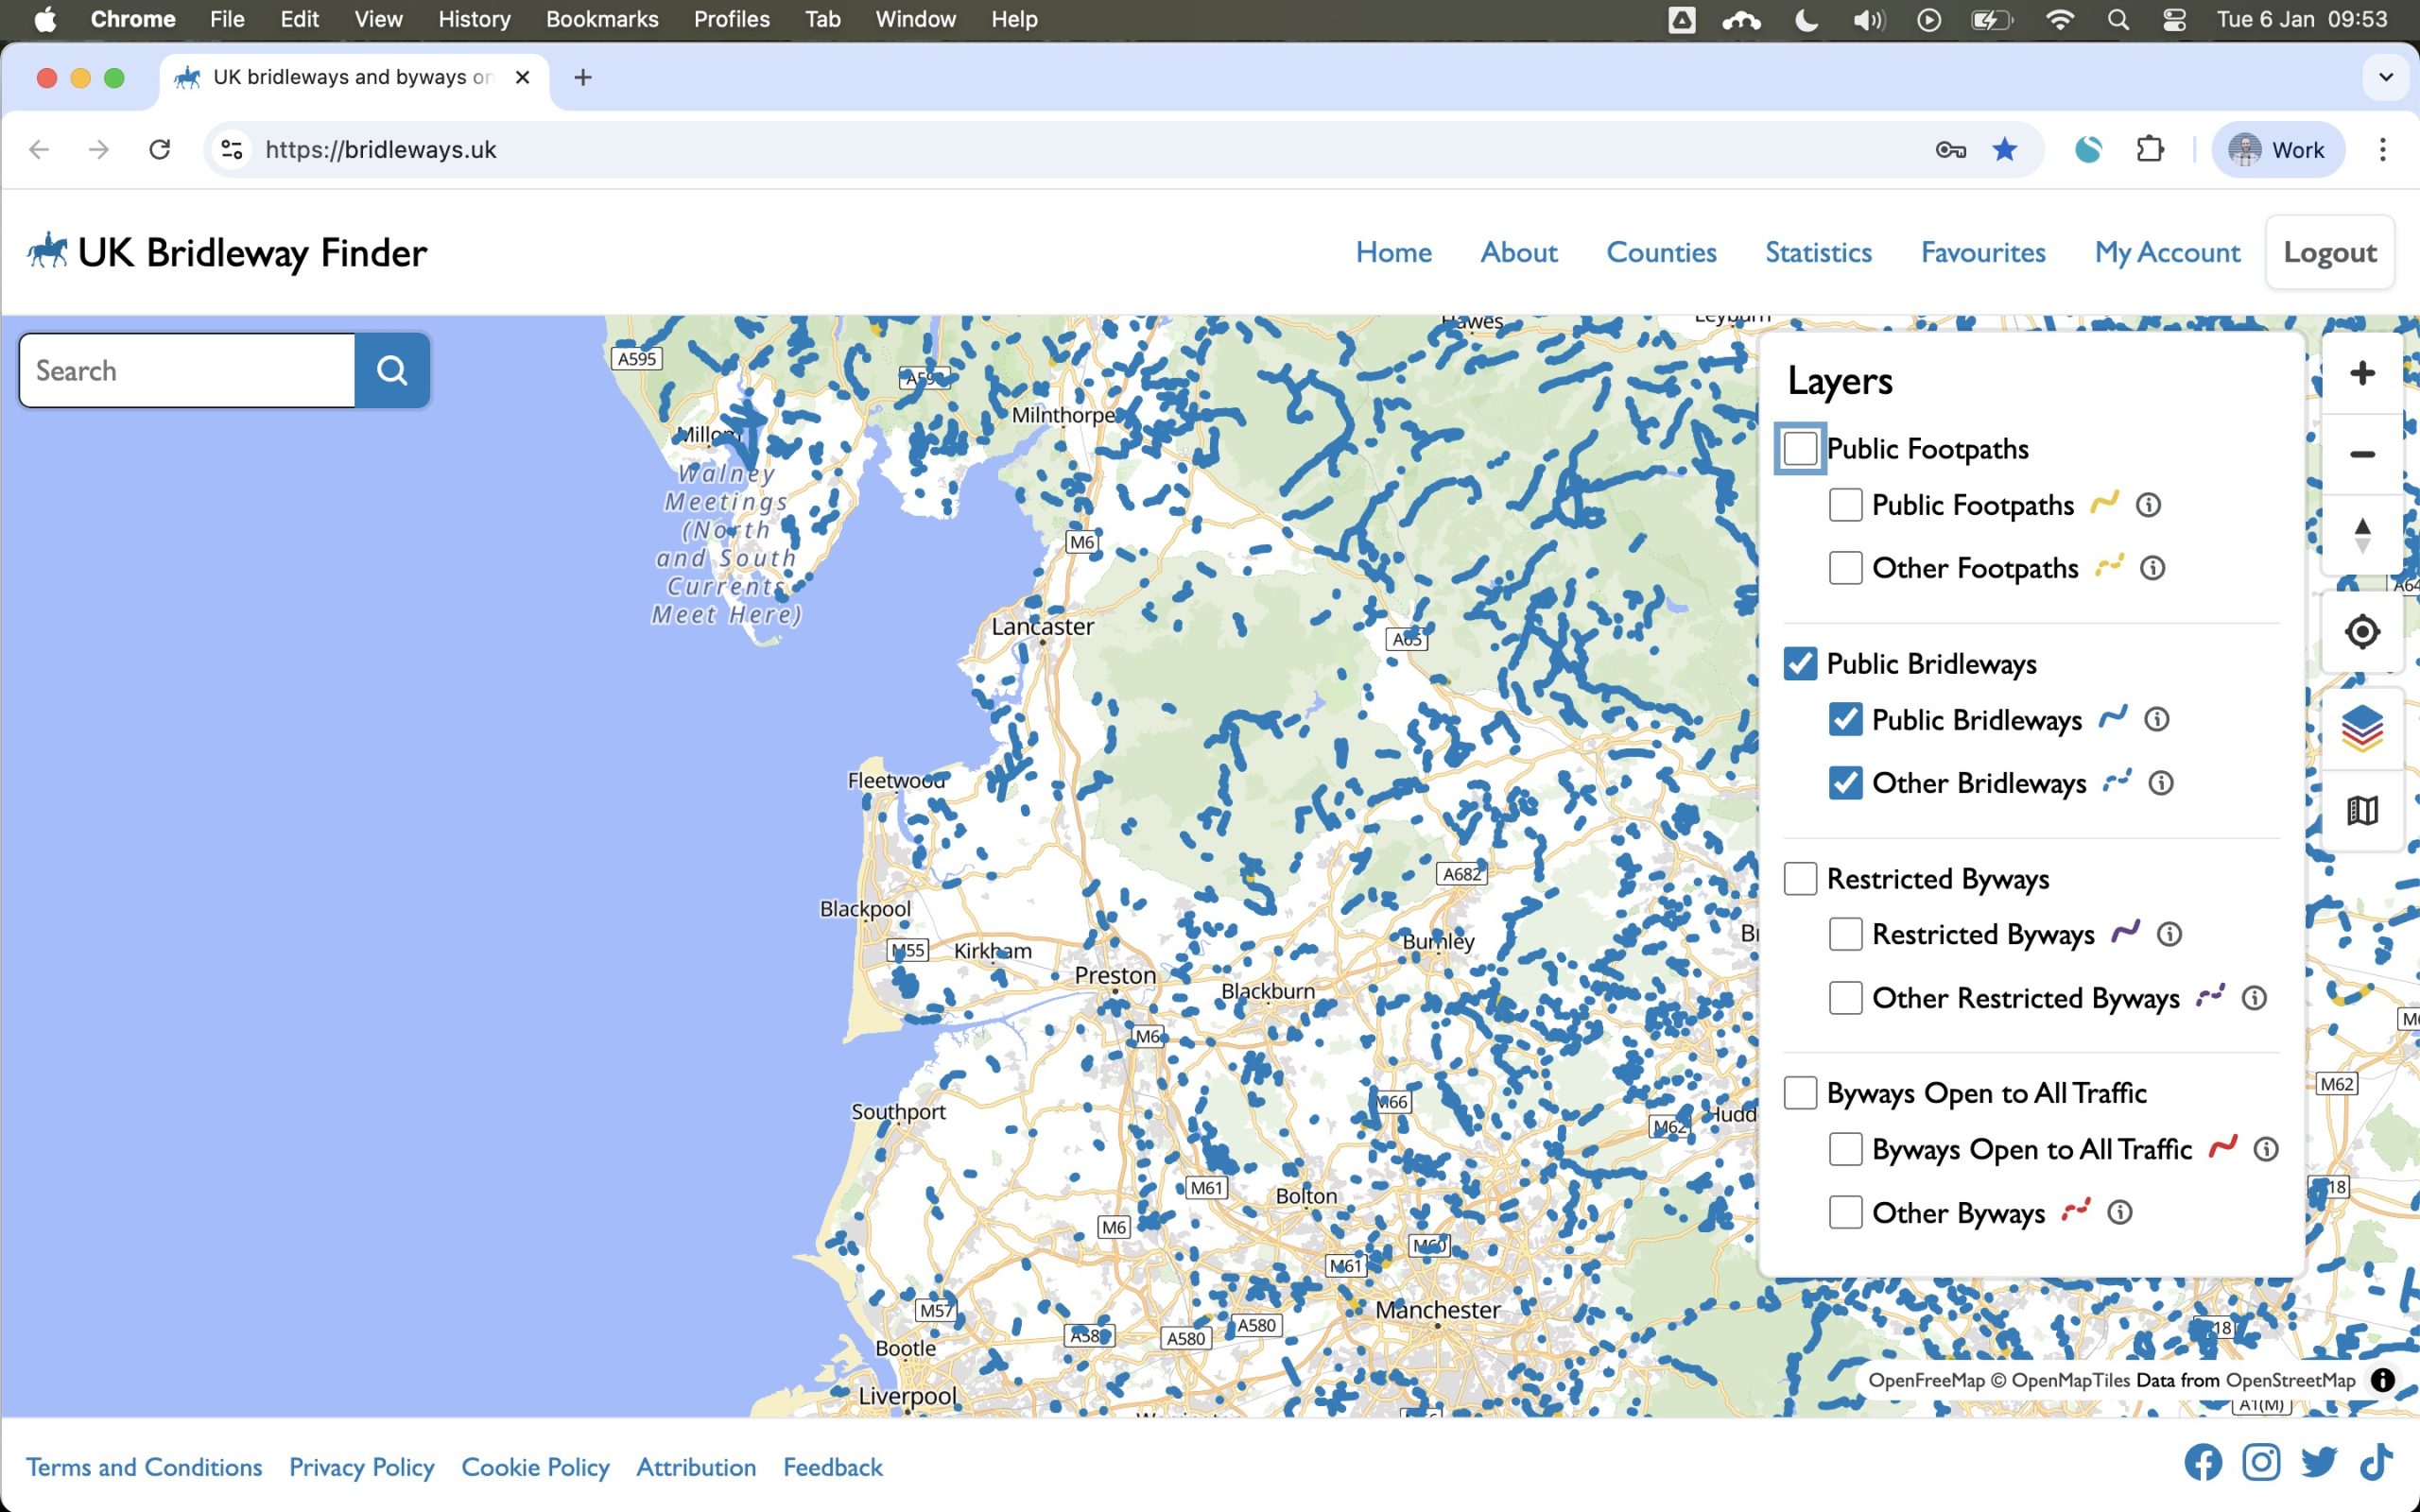
Clunky site, I prefer this one for search bridleways https://footpathmap.co.uk/
Bridleways.uk is nice but comparing miles of bridleways for local authorities doesn't mean much because the local authority areas vary so much in size. It also misses paths where it's permitted to cycle on (such as towpaths).
I made maps normalising by local authority area, population, and number of roads: https://laurencetennant.com/cyclability.html . The one I like most uses number of roads, although it still undercounts open access moorland areas.

Wow - @hyper_real is that your own work? It's very impressive
Looking good in my area, nice thing to geek out on
Very timely post, with the recent weather I've taken up exploring the local Bridleways.
Had some fantastic adventures - I also discovered a private track that a farmer has opened up as a permissive bridleway that has some spectacular views of the Duddon Estuary. It also shaves off a massive hill, which is nice!
Not sure about the rest of the country but they are not well maintained here to be honest, so carry a puncture repair kit!
The split of byways vs bridleways is interesting (or not!)
Cambridgeshire seems to be massively swayed towards byways at over 60% of rideable miles. Versus neighbouring Hertfordshire where byways are around 10% of rideable miles.
EDIT: Now I've actually registered and looked at the map, the Cambs byway excess looks to be due to the masses of byways in the Fens.
Wow, shocking that Easy Sussex, which is quite rural, only has 54 miles of bridleway
I find that hard to believe living on the eastern edge of Brighton. Seems a lot more than that around me. I do know that a lot of the ones closest to home don't show as such on the map despite being signposted
Wow - @hyper_real is that your own work? It's very impressive
Looking good in my area, nice thing to geek out on
Thank you! Datawrapper.de does all the heavy lifting to make the nice visualisation.
Wow, shocking that Easy Sussex, which is quite rural, only has 54 miles of bridleway
I find that hard to believe living on the eastern edge of Brighton. Seems a lot more than that around me. I do know that a lot of the ones closest to home don't show as such on the map despite being signposted
I can't figure out why their numbers for Sussex are so low. In the table for my map Lewes alone has 300km of off road cycle routes, granted some of which are "tracks" rather than bridleways. But even on the bridleways.uk map Sussex has a high density of bridleways.

I've done quite a bit of horse riding in mid-Wales and there were a lot of horse-friendly routes there (as you can't lift a horse over a stile or fence so footpaths are rarely a good bet!)
Down in the South Downs vicinity I'm not sure I notice what's a bridleway and what's a footpath (I consider the latter fair game on a MTB) and what's just somewhere we ride because there's a trail there. You only have to do a little bit of historical digging to see that the whole concept of countryside ownership is an archaic travesty - yes well done, you had particularly vicious ancestors who subjugated ours, so you get to tell us where we can ride our bikes...
Although interesting, the data on the Bridleways.uk website does not seem robust enough to use for making any kind of comparison.
For example in Surrey it claims that there are only 2.7miles of BOATs.
Even just considering the ones very local to me such as Wolvens Lane on Leith, Beggars Lane, Sheepwalk Lane and Hogden Lane on Ranmore there is at least 10 miles. I know that there are many more further in to the Surrey Hills, and plenty around the military areas further West.
This makes me question the quality of the data elsewhere.
Try Herefordshire:
BOATS - 44.5 miles
Byways - 3 miles
Bridleways - 27.3 miles
Footpaths - 2167 miles
Total Rideable: 74.7 miles
Data seems terribly inaccurate just from a casual glance. Surrey should be in the top ten easily, perhaps even top 5. CBA creating an account to see what that database says.
Edit: Surrey apparently has 1.2 miles of bridleway / Boat per sq mile compared to 0.7ml in North Yorks. Fun thread, but...
Staffordshire has 0 BOATS according to that.
That's our planned 'off road' motorcycle ride in Staffordshire this Saturday knackered then... 🤔
Seems to be very inaccurate imho.
Data seems terribly inaccurate just from a casual glance. Surrey should be in the top ten easily, perhaps even top 5. CBA creating an account to see what that database says.
Edit: Surrey apparently has 1.2 miles of bridleway / Boat per sq mile compared to 0.7ml in North Yorks. Fun thread, but...
The top three in the article are North Yorkshire, Westmorland & Furness, and Northumberland. Guess what the top three largest counties by area are. It shows that you need to normalise by area or some other metric as length alone is meaningless.
I did send my maps and article to the Singletrack editorial team a few months ago as an article idea, but didn't get a response. I'm glad this article got published as it's interesting topic, but it's a shame to base it on the bridleways.uk data because its a site focussed on horse-riding not off-road cycling (so does not include a lot of cyclable paths), does not appear to be accurate, and mixes together counties and local authority areas.
Co. Durham showing as 0 miles restricted byway, which is wrong as some of the routes across Hamsterley common and around Wolsingham have this status.
That data is miles out. I'm in East Sussex, where we apparently have just 1.2miles of BOAT and 4.9 miles of restricted byway. I can identify more than that just in the routes I ride from my door. This has got to be under-reporting by at least an order of magnitude.
I've double checked on the East Sussex.gov rights of way map, which confirms that there are more BOATs on just the levels than the bridleways map says there are in the whole of East Sussex.
Not sure this is correct considering Derbyshire has High Peak Trail, Tissington Trail, Monsal Trail, Manifold Trail (part of!), Cromford Canal, Carsington Water etc. Plus the many 'proper' bridleways that criss-cross the county. Seems on the low side to me.
It does seem low - but not to worry, there are plenty of tasty footpaths anyway 😉
Assuming we could obtain accurate(ish) information, it would be interesting to see the mileage per square mile of county, to provide some sort of comparison across counties.
Assuming we could obtain accurate(ish) information, it would be interesting to see the mileage per square mile of county, to provide some sort of comparison across counties.
Sorry to keep mentioning it, but you can see that in https://laurencetennant.com/cyclability.html /p>
Assuming we could obtain accurate(ish) information, it would be interesting to see the mileage per square mile of county, to provide some sort of comparison across counties.
Sorry to keep mentioning it, but you can see that in https://laurencetennant.com/cyclability.html /p>
I'll join in with the plaudits - cracking work, shame STW Towers didn't pick up your email.
Now, if you could just spend a couple of hours creating a heatmap where thay all are - just Derbyshire Dales will do for now 😉
I'll join in with the plaudits - cracking work, shame STW Towers didn't pick up your email.
Now, if you could just spend a couple of hours creating a heatmap where thay all are - just Derbyshire Dales will do for now 😉
Thanks for the kind words. The best place for that type of data is the Strava heatmap set to mountain bike ride, I've found it a great resource for seeing where people actually ride: https://www.strava.com/maps/global-heatmap?hl=en-GB&sport=MountainBikeRide&style=dark&terrain=false&labels=true&poi=true&cPhotos=true&gColor=blue&gOpacity=100#9.73/53.1743/-1.6717
@hyper_real Excellent website! No email arrived in my inbox, soz 🙁 Glad to see such sites getting an airing on here anyway! 👍
2026 miles, of bridleways!
Sounds great but - this is North Yorkshire. There are parts of North Yorkshire that are so far away from me, that in other parts of the UK they would be 3, 4 even 5 counties away!
Miles of Bridleway per Square mile would be a rather more useful stat.
There are 14.9 miles of bridleways in Carmarthenshire. There are no restricted byways and there are 58.4 miles of byways open to all traffic, which add up to a total of 73.3 miles of hackable routes in Carmarthenshire.
Barely anything, which matches my efforts to find any to ride. The ones anywhere near me are well used by horsey types and poached to hell, basically impassable by foot or bike.
On the bright side, we have miles and miles and miles small back roads where you can ride for hours and hardly see a car 🙂
Interesting site, but woefully inaccurate.
It does show a fair few near me, but also fails to show loads that are sign posted as bridleways, etc.
We also have miles of unsurfaced county roads and unmetalied roads around here - all used regularly by horses and bikes.
Hmm, virtually the whole of the Consett-Sunderland sustrans route is missing (C2C) along with much of the Derwent walk (the other C2C), most of the Tyne valley cycle path. That's at a cursory 5 min glance. Think I'll stick to using the local council PROW sites.
No idea. There's is no database of them all. Best number i can find is 6900 registered trails in the county. The single longest trail is about 700km and of the ten longest i've found, seven are over 150km...
Also, the county is 3 times the size of North Norkshire.
Obligatory "not living in the UK" comment. (Also, only about 1.8 million people in the same area!)
Northumberland has took me by surprise, I’d never had guessed at it being 3rd. It alway seems to lacking bridleways, unless of course there’s a lot of them but short distances. Northumberland has always been very rural, not industry driven so I’d thought that would have been a reason to be less.
Hmmm.... All the formal trails being mentioned (such as tissington, high peak) are often actually only Footpaths (if PROW's at all) with permissive access granted to other user groups... So their exclusion may not be because of the consent to ride, the the legal right to ride them...
Similarly canal towpaths are effectively private land, some of which have PROW Footpath status, but all CRT ones have the owners consent for use by bike (but NOT a ridden horse).