Forum menu
So they know kids are mostly asymptomatic,
And they'll only test those with symptoms...
Didn't Joseph Heller write a book about this?
I read a report that 80percent of positives have no symptoms...which made me think the whole testing thing is useless as 80percent of people would be getting on with their daily life and spreading the virus. While only 20percent of people with the virus have symptoms been tested and are isolating.
That's why (working) contact tracing is so important Sefton.
I read a report that 80percent of positives have no symptoms
80% of what? The ons survey? Liverpool testing? General testing through t&t?
The stat you've rolled out there would be really good and would mean that 80% of the population at large could forget about the whole thing. So now - how sure about this report are you?
IIRC they are testing folks with no symptoms, last numbers I saw were of 44000 tests, 250 ish were positive, about 0.05%.
At first glance, that seems low, but (only looking at Scots figures here, as thats all I've been looking at!) 'normal' testing, that of people who are actually showing symptoms, is around 6 or 7%, so going by that, you'd be looking for a much lower number tbh.
The Liverpool numbers would refute that, would they not? ie there's not a huge number of asymptomatic people at large.
The stat you’ve rolled out there would be really good and would mean that 80% of the population at large could forget about the whole thing.
Which is what has been said from the start:
Chris Whitty:
a point we made right from the beginning is that for many people this remains a mild infection
The Liverpool numbers would refute that, would they not? ie there’s not a huge number of asymptomatic people at large.
This is probably linked to the sample of people volunteering to take one of the new tests, which wont be a representative same of the general population, in the way that the ONS survey is.
If people dont have any symptoms why would they volunteer to have a test?
There seems to be a significant amount to lose (isolation, loss of earnings, etc) and not much to gain (confidence to visit vulnerable relatives, general piece of mind)
Remember, the ONS report is stating that people had no symptoms at the time of the test, not that they never developed symptoms (mild or severe) later. They could will have been pre-symptomatic, rather than asymptomatic.
Once again, the media headline does not quite match the data.
Why aren’t we
Just look at what we have in charge.
oh, and
so what does that mean for our current LockDown Lite?
We just gonna keep trollin on through winter bouncing between "growing quickly" and "only just growing" infection levels? or something else, another proper lockdown? do a USA and give up entirely?
What is their estimate for R in England?
The TPT was very busy earlier, almost like a bank holiday.
I was really hoping that as we moved into winter the trails and paths would go back to normal.
Too many casual cyclists without a clue, entitled dog-walkers and passive-aggressive ramblers.
And you were on it too, like a driver moaning about traffic! 😆
https://www.google.com/amp/s/amp.theguardian.com/world/2020/oct/08/more-than-80-positive-cases-in-covid-study-had-no-core-symptoms/blockquote >
Oh. You'd hope the guardian would be a bit more careful. More or Less covered this a week or two ago and referenced the sun.As Kelvin above. It's not the full picture.
And you were on it too, like a driver moaning about traffic! 😆
I take your point but I'm not a casual or recreational user, plus I have a clue about how to ride a bike 😀
Lol, sorry, couldn't help myself!
We just gonna keep trollin on through winter bouncing between “growing quickly” and “only just growing” infection levels?
Pretty much like TiRed has been saying since the start then. There is no good option. But open and honest communication is his forte, not the government's.
Well Wales is reporting more Covid cases now in hospital than at the peak of the first wave, both confirmed and suspected cases. Seeing as they're still going ahead with the regular operations and treatments at the moment and having to work with reduced staffing numbers there is a real fear that capacity could quickly be reached. Thankfully the effects of the firebreak have still yet to filter through so there should be a reprieve on the way.
Keeping track of the usual winter spike in admissions is going to be critical.
R not below 1
so what does that mean for our current LockDown Lite?
It means that it's only been in place for a week so if it is affecting the spread of the virus it's still waaaay too early for any effect to be visible in that data. Come back in 2-3 weeks by which time it might be affecting cases, 3-4 weeks for hospital admissions and 5-6 weeks for deaths.
Just watched the latest Sage report. Really hard to take any positives from it at all. It seems like schools are quite clearly a driver, but I think we have known that for some time. How this can be managed, I have no idea. I'm just going to try and have a chilled out weekend, before I end up hitting the wall again.
Sage report on lockdown 2 released today
Seems to be saying with R at 1.1 daily deaths should be below 500
But we are consistently above that (~550)

Does that mean R is above 1.1 or is it just the lag?
Deaths do seem to be above projected (as I believe captain was saying)
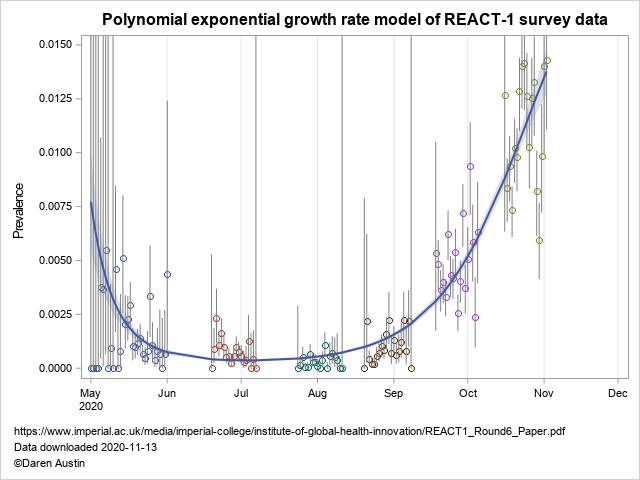
React Round 6 data from Imperial - I've run an exponential cubic polynomial through the data and I think it shows a pretty clear picture. No spline wobbles @thecaptain - and I really don't think there should be either!
But open and honest communication is his forte, not the government’s.
Thank you. I try my best to make the science accessible.
But we are consistently above that (~550)
Deaths within 28 of positive test by date of death The headline panic number is too aggregated - the underlying rate is the 7-day rolling mean.
R in Scotland is now estimated to be below 1.0 but still a high number of deaths. Again, I assuming this is the lag, but it would appear that regional variations are greater than ever with some areas projected to go into Level 4 (that's tighter than English Tier 3) while others remain in Level 1. Unfortunately we're still seeing folk travelling between/across high and low level areas.
Deaths within 28 of positive test by date of death The headline panic number is too aggregated – the underlying rate is the 7-day rolling mean.
I just checked the government website and the 7 day average is nearer 400 - but rising.
Not surprisingly, having ignored the experts on 21 September the government has acted too late and too weak, and to my untrained eye numbers risk getting properly out of control again. I can only see a longer/harder/proper lockdown being needed and what's left of Christmas is cancelled.
Could it be that there are more vulnerable people this time of year who would be more susceptible if they caught the virus?
More elderly people going into hospitals and catching it there?
Basically the number of vulnerable going up?
Is there anything in this?
regional variations are greater than ever
Very much THIS. It's why the North is being hit but the South has modest transmission. Northern Ireland, Wales and Scotland all had significant interventions. Regional evaluation is more important than ever as there is a decoupling now that becomes ever more magnified due to the amplification of exponential growth.
There is good evidence that the growth rate is falling below 3-5% per day towards static and even shrinking rates.
For the more detailed death data click on deaths then select region
https://coronavirus.data.gov.uk/details/deaths
To track transmission, look at hospital admissions by region, these are a better measure of community infection levels. So for the North West
https://coronavirus.data.gov.uk/details/healthcare?areaType=nhsregion&areaName=North%20West
This data has a slight lag, but it's fine for robust inference. Admissions are by NHS regions deaths by ONS region (Midlands and North East and Yorkshire split)
Sefton
I remember from the last lockdown a quote of 50% of shielders being under 50.
That means there's a lot more vulnerable people with virus pathways into their homes now with schools open, than in lockdown 1.0 with them shut.
Back to that 80% asymptomatic thing, that More or Less discussion of that statistic is here https://www.bbc.co.uk/programmes/p08wy93c
As I think Kelvin pointed out, it was 80% had no symptoms on the day they were tested, but we know that people are most infectious just before symptoms show up.
As I think Kelvin pointed out, it was 80% had no symptoms on the day they were tested, but we know that people are most infectious just before symptoms show up.
What does that mean?
Does that mean of people who have symptoms or people who are infected?
What do we mean by symptoms given some fairly high percentage have "no symptoms" and others might have symptoms that are or are not related to SARS-Cov19? I mean presumably you could have the virus and show no symptoms then pick up a different strain of a corona virus or rhino virus and have symptoms for that?
Suppose you are infected for 14 days, but it takes 9 days before viral levels are high enough and disease sufficiently progressed to show symptoms. Then a random uniform sampling will show no symptoms on 9/14 days. It's not serial swabbing of an individual, it's cross-sectional sampling. It's also true that some people NEVER show symptoms (about a third), but that's not the same thing.
That's a better curve than REACT managed @TiRed but I don't like the fit through Aug and Sept.... looks rather too high. I'm going to have to have a go at that data set soon but right now working on the ONS survey stuff.
Suggest you follow the link Steve. It's only 10 minutes long
If you look on the hospital admissions tab here: https://public.tableau.com/profile/public.health.wales.health.protection#!/vizhome/RapidCOVID-19virology-Public/Headlinesummary
If you scroll down to the weekly admissions, you can see that the firebreak has had an effect. The graph makes it look like the admissions are still lower than the first wave which suggests when compared the BBC article that people are spending longer in hospital?
That’s a better curve than REACT managed @TiRed but I don’t like the fit through Aug and Sept…. looks rather too high
Indeed, it's just f(x) = exp(a0 + a1*DAY + a2*DAY**2 + a3*DAY**3), with a binomial likelihood. A quartic is a better fit (P<0.001), and a quintic too, but by then it's just for fun! pairwise polynomial is also presented in REACT, which is better, but taking triple surveys with curvature is probably more helpful - so 123, 234, 345, 456. At least then you can account for local changes in policy. No way would I trust a spline projection.
Drop me a note and I'll send you a post-processed analysis dataset with samples by date and region.
Suggest you follow the link Steve. It’s only 10 minutes long
I'm old and stupid and can't remember my BBC password ...
33k yesterday 27k today, its looking like the flattening on cases didnt happen to me.
If you look at the cases graph here
https://www.worldometers.info/coronavirus/country/uk/
the 33k looks like it fits the curve if you ignore the flat bit in between. If you imagine 27k behind it it starts to look worse.
33k yesterday 27k today, its looking like the flattening on cases didnt happen to me.
a_a - reported cases are confounded by the testing strategy, and that is cases reported today NOT cases with a specimen date of today so any reporting delays on batches of tests will cause noise in the data. It's not worth stressing about changes in the daily reported case figure - check the 7 day average by specimen date at
https://coronavirus.data.gov.uk/details/cases
or look at the ONS/REACT case figures (or don't as fitting a curve to them seems problematic) or look at the ZOE case figures (or don't as they are ML projections rather than clinical data). Or forget about cases and as TiRed has repeatedly said, look at hospital data but don't expect that to reflect the current English restrictions for a while.
@ferrals - I did wonder whether people staying in longer might be having an effect. Add in better treatments meaning fewer deaths and there could be the issue of beds being tied up for longer looming too. Is till thin it's too early for the full effects of the firebreak to show just yet, maybe by the middle of next week things should look more positive.
33k yesterday 27k today, its looking like the flattening on cases didnt happen to me.
If you look at the cases graph here
When the 2nd lockdown was announced a lot of people piled into pubs/restaurants, visited friends and family for the last time Etc. Factoring in the incubation time, delay in getting a test, delay getting results and reporting delays the uptick in numbers in the last few days could possibly correspond to the period just before lockdown.
I believe flu admissions are initially being treated as suspected covid which makes sense.(about 3 weeks back the BBC said only 2 influenza admissions in 1 whole week in the uk)And if the covid turns out to be flu the data is retrospectively corrected? However how long does this take to correct? I worry if this is true then we are printing news from the latest (possibly wrong in this instance) information...and possibly making new restrictive policies based on this data...is anyone looking back to check?
a_a – reported cases are confounded by the testing strategy, and that is cases reported today NOT cases with a specimen date of today so any reporting delays on batches of tests will cause noise in the data. It’s not worth stressing about changes in the daily reported case figure – check the 7 day average by specimen date at
Looks even worse tbh.
Or forget about cases and as TiRed has repeatedly said, look at hospital data but don’t expect that to reflect the current English restrictions for a while.
You can do that and obviously its better data for making predictions, however I still maintain that its like driving a car looking out the back window. By this point we should be able to fairly accurately fit case data to hospital admissions and deaths down the line by using data on testing effort and daily cases.
Now clearly this current jump is just two days data but it should be making people twitchy somewhere.
Factoring in the incubation time, delay in getting a test, delay getting results and reporting delays the uptick in numbers in the last few days could possibly correspond to the period just before lockdown.
I also wonder what impact half term had just before as well.