I'm dabbling with training and using Intervals.icu for some rudimentary analysis.
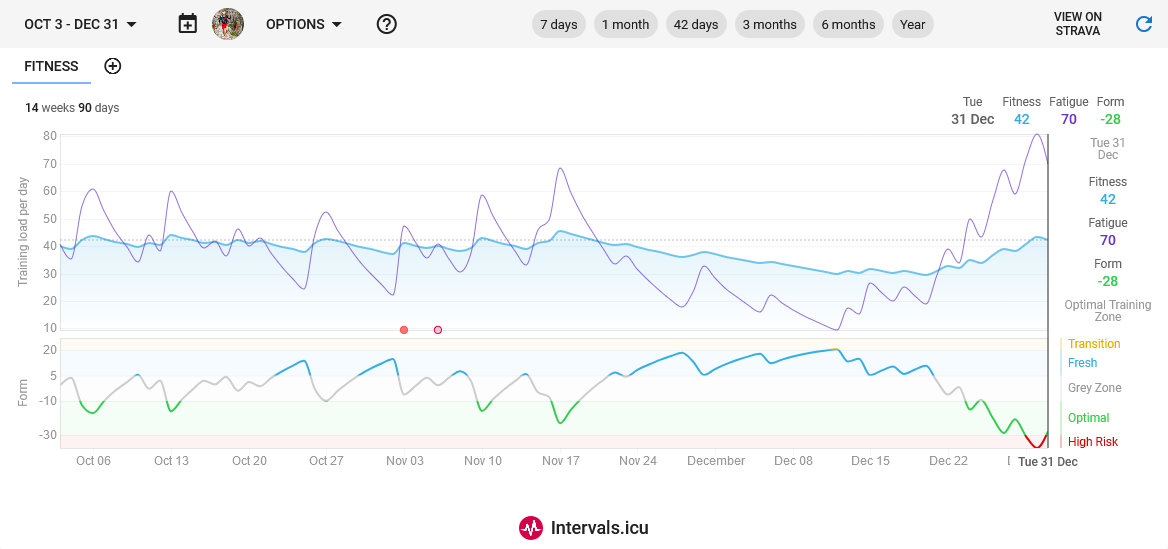
I'm not sure I understand their fitness chart:
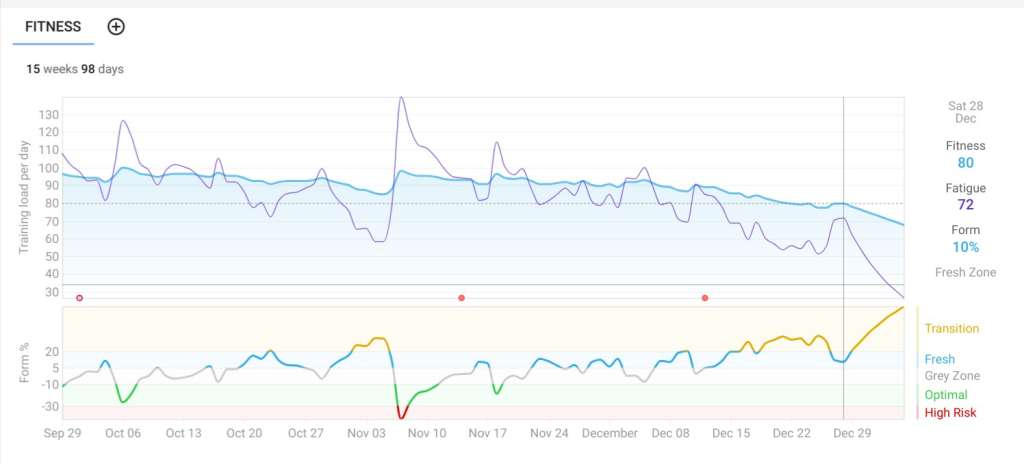
This is their explanation:
The blue line shows fitness. This is a 42 day exponentially weighted moving average of your training load.
The purple line shows fatigue. This is a 7 day exponentially weighted moving average of your training load.
To get fitter you need to create stress by increasing training load i.e. keeping the purple line above the blue line.
Your form is your fitness less fatigue. When your form is in the optimal training zone you are gaining fitness.
When your form is fresh and you are fit then you are ready to race.
Avoid staying in the high risk zone for long or you might become over-trained. You need to include periodic rest weeks in your training to recover from fatigue and to be at your best for goal events.
So if I understand it, I haven't been working hard enough for long enough to get any fitter as the purple line isn't above the blue line for any meaningful time.
Presumably (ideally?), if you're targeting a specific event you train/rest such that you move into the optimal zone for the event and then try to remain in the Fresh zone at other times??
Or have I been getting fitter because I seem to spend a lot of time in the Fresh zone?
Keen to hear the explanation as I'm also using it and despite my purple line being above the blue, my fitness isn't improving (seems to be declining!)...I'm not doing any structured training though so suspect that isn't helping.
@DickBarton is that feels like it's not improving? Do you take rest days/weeks?
There is nothing structured about my riding, so suspect that and my poor diet (trying to badly shift weight and eating less so not quite got the energy for my riding) - I can't seem to get above a woeful 26 (currently 22) for fitness on intervals.icu. However, my legs don't feel so tight so things are improving and if I don't need to put speed into the ride, I can ride all day.
As said, I'm not structured and need to improve several things that I think will make improvements.
So if I understand it, I haven’t been working hard enough for long enough to get any fitter as the purple line isn’t above the blue line for any meaningful time.
I don't use intervals.icu but I've seen these sorts of things before and that's how I understand it as well. Your 'fitness' isn't going up because your training load isn't going up. If you stay at the same training load for 42 days then that is as high as that fitness line is going to get. You get fitter by constantly increasing your training load but if you do that too fast then you risk injury or overtraining which is what the bottom chart is showing you. If you increase your training load to quickly then the 'form' line will go into the high risk area because your purple stress line is too high above your blue fitness line. These things are just a way of making sure you are increasing your training load at a sensible pace.
As mentioned above you are normally expected to back off every few weeks to give your body a chance to recover and then ramp up the load again.
Training load of course isn't just training volume. It's a mix of how long and how hard you train.
That's how I understand it anyway.
Yeah, Fitness is "load" so you can spike it with one big day but you'll also cause Fatigue. Fatigue diminishes faster than fitness though so you'll retain some benefit. Maintain a consistent load and you'll not see Fitness improving.
That graph doesn't really show periodicity - the benefit of having a lighter week occasionally for Recovery - but that's also something worth building into.a plan. I've kept a steady(ish) load going the past few weeks and it's definitely helping. Garmin tells me my VO2Max has gone up a wee bit.
The first principle of training for sport is progressive overload. If you're training well, the chart should show a gradual rise in fitness which is built by steeper shot term peaks of fatigue followed by dips when you have a recovery week - i.e. four steps forward, one step back type of thing. Unfortunately, your chart shows the exact opposite - if you reversed it, then it would actually look pretty good.
What this means for you is that you're not building enough fatigue (in a block) to produce more fitness. You need to gradually increase intensity + duration over a few weeks in order to keep pushing form into the 'optimal' zone, then maybe a brief dip into 'high risk' at the end of say a 4-week block, before having a rest week and allowing form to come back into the 'fresh' zone. You would then start gradually increase intensity + duration again, which would reduce your form and increase fatigue. Fitness is built in the 'optimal' and high risk zones, but if you stay in high risk too long you risk burn out/injury.
So the 'optimal' zone means optimal for adaption/training. You want to be in the fresh zone for a race (i.e. on top form) but when training you should spend most time in optimal zone with brief dips into the red occasionally and then the other way into 'fresh' when you recover. Form is opposite to fatigue. High fatigue is needed for training, but high form is needed for racing.
So if I understand it, I haven’t been working hard enough for long enough to get any fitter as the purple line isn’t above the blue line for any meaningful time.
That's pretty much the case. To improve you need to put in efforts above your current fitness level. But, that will eventually put your form down into the red area which is unsustainable. Hence the need to have recovery periods which will cause your fitness to drop but your form to recover. Here's a typical bit of my chart.
Presumably (ideally?), if you’re targeting a specific event you train/rest such that you move into the optimal zone for the event and then try to remain in the Fresh zone at other times??
Wrong way round. You need to train in the optimal zone (optimal here means in terms of training load, not readiness for an event) then taper towards your event which will bring your form up to fresh (meaning recovered) ready for the event.
Have a read up on TSS (Training Stress Score) which is what this chart is all about.
Or have I been getting fitter because I seem to spend a lot of time in the Fresh zone?
No. You are not getting fitter. Your fitness line is generally declining. Look at it this way. If your current fitness is 90 then your daily training load needs to be 90 in order to stay at the same level. To improve, your daily input needs to be significantly above your current level.
Look at it this way. If your current fitness is 90 then your daily training load needs to be 90 in order to stay at the same level.
Yeah, that seems a nice summary ?
Weird thing is, is that Garmin tells me I'm way above intensity minutes target (though now I'm thinking their intensity target minutes are way too conservative...) (I'm assuming intensity minutes is related to TSS). And my VO2 max has been gradually increasing over the last 8 or so weeks.
I do some "meaningful" exercise every day from walking the dog, to somewhere between 1-2 hours of outdoor road riding (mostly Z2) plus at least one turbo training session (usually targeting high aerobic or anaerobic zones). Granted, I don't do "rest weeks" as my legs get too restless if I don't get a good work out at least once every three days....
I guess I need to have more turbo sessions or increase duration first...
Garmin intensity minutes is just time spent not 'resting', it has no real bearing on fitness, just how many minutes you've been doing something that has got you moving and your heart rate up a bit.
In Garmin you can set an intensity minutes target and have something to aim for. If you are constantly beating it then you probably need to adjust that setting to be higher - but that in itself won't improve your fitness.
somewhere between 1-2 hours of outdoor road riding (mostly Z2)
Is that every day?
Is that every day?
Not at this time of the year unfortunately!
Looking back over Decembers rides so far, I've got 11 OUTSIDE rides totaling around 20hrs. Most of that will be Z1/Z2 but there's several BIG climbs in there which were Tempo or harder.
I've also got about 5hrs of turbo training which includes a crit race and a time trail (both max efforts) plus quite a few short sessions training to work out my 3 minute and 8 minutes max power. So all 5 hrs over come off the trainer dripping with sweat and exhausted!
I'm starting to suspect that I've plateaued in my fitness (I'm 61) and any noticable fitness gains are gonna be very hard to find (or I've got to man-up...)
Hmmm
I’m starting to suspect that I’ve plateaued in my fitness (I’m 61)
That doesn't have to be so, but it's sure going to be hard to develop your fitness any further, especially if you are already pretty fit. I'm 66 now and I'd say almost as fit as I've ever been. Certainly more fit than at any time I started to measure/care about these things. I know I've said it previously but the biggest change to my fitness has been doing a lot more running.
Just out of curiousity, what is your VO2 Max? Even given the limitations of consumer electronics, that's a pretty good measurement of fitness (and longevity).
Just out of curiousity, what is your VO2 Max?
54 [Top 1% of my age group according to Garmin 😉 ]
I think that answers your question 😀
I guess so. What prompted this post was that, while my Garmin stats suggest I'm doing everything correctly, Intervals.icu confused the hell out of me...
In anticipation of more shitty weather, I'll be ramping up the turbo sessions so I'll periodically check the Intervals.icu fitness chart and, hopefully, I'll be able to figure out how to spend more time in the "optimal" zone...
I've been wondering if there's fitness (Strava or intervals) and there's fitness (real you physiology)
I've done the fitness chart thing (strava, crickles, Intervals) and that curve increases based on effort, with no granularity or information on the kind of effort taken part in.
But - I've just spent a few weeks doing lots of Z2 and less on TrainerRoad. I was fretting because my fitness curve was declining cos intensity and tss load was declining. And i thought my fitness was going down. But i went out on the mtb in the mist today, and i was able to do stuff that would normally blow me up, but doing it in Z2 or 3. and i got a couple of strava 2s and 3s, despite the mud and slip.
So i suspect that the fitness curve is a bit blunt as a way to measure fitness. And that might be what you're experiencing Vlad - you're doing lots of intensity to boost the curve, but it's not building your fitness cos you're just using one high intensity rather than training different elements of your physiology....and as you suspect you've plateau'd/overtrained. Maybe try to do some low impact stuff for a while to recover?
And that might be what you’re experiencing Vlad – you’re doing lots of intensity to boost the curve, but it’s not building your fitness cos you’re just using one high intensity rather than training different elements of your physiology….and as you suspect you’ve plateau’d/overtrained.
Not true! I've got what I think is a good spread of intensities (at least for December...)
Maybe try to do some low impact stuff for a while to recover?
One thing I'm useless at is backing off completely. I suffer badly with restless legs and/or a feeling of aimlessness if I don't, at least, spin the lactic acid out of my legs every couple of days. So I never have complete "rest weeks" - at most, I'll have about three consecutive non-riding days.
Also, my max tolerance for the turbo trainer is about an hour - so if the weather is shitty, I end up doing short but intense turbo sessions to feed my desire to do something "productive" ?
I’m impressed with the fitness scores posted for this time of year. I have been up at 90 but not since the summer. As mentioned earlier in the thread a high fitness score requires a high training load to keep it there or improve. That can be tough at this time of year with short days and poor weather conditions. My fitness score is currently 60 so regular shortish bike rides will keep me improving. I’m hoping to get up to 90 by April. My fitness score was down at 33 in early November.
It’s not easy to keep your fitness really high all year round. Most people aim to peak for certain events or race season. It may well be better to let it dip a bit at this time of year and build back up again for spring.
I also recently learned that I can do easy interval sessions. I always thought intervals had to be hard, zone 4 or 5 and couldn’t just turbo with no intervals as I found it too boring. So recently I went on the turbo for a Sufferfest Wahoo session. On the recovery sections I just ride zone 1 as directed when the hard intervals came I just upped the cadence to zone 2. The session was kept interesting as I was constantly changing things every few minutes but it didn’t burn me out and I could repeat similar sessions everyday. After about three easy sessions I would then do a hard one.
On the recovery sections I just ride zone 1 as directed when the hard intervals came I just upped the cadence to zone 2.
This is my normal just riding along routine on real-life riding. I rarely get into Z3/Z4 and usually only for short periods. It's hard to replicate that indoors on a trainer unless you've a high boredom threshold though. I'm currently using the Tacx app which just shows videos of real life routes and they're often interesting enough to distract me for an hour or two.
Looking back over Decembers rides so far, I’ve got 11 OUTSIDE rides totaling around 20hrs. Most of that will be Z1/Z2 but there’s several BIG climbs in there which were Tempo or harder.
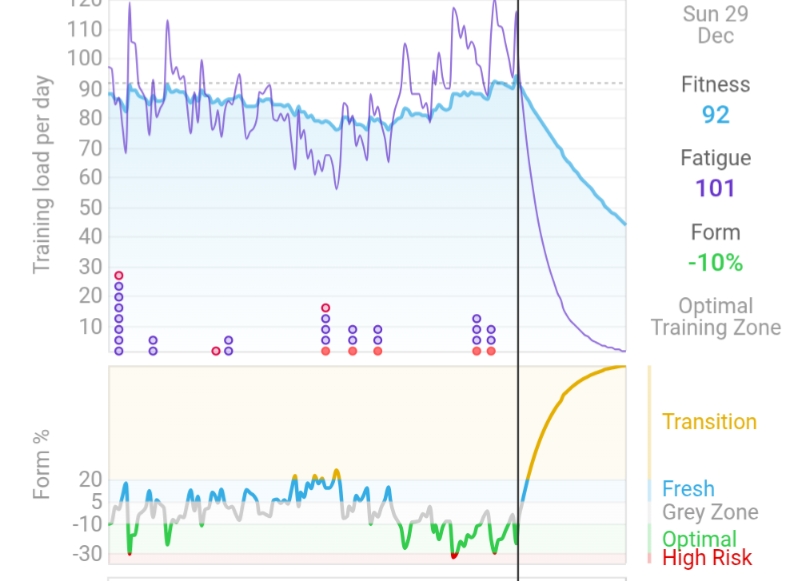
From your chart it looks like you worked harder in November. I'd also be intrigued to know what you had been doing before October to achieve that 100 (almost). Have a look in the Totals page on intervals.icu. That will give you total load over any period you care to enter, load by activity, time spent in HR zones, etc. etc.
I’ve got what I think is a good spread of intensities (at least for December…)
So I think there we have it. Your intensity is lower than earlier in the year (and looking at your chart so is your total load) so your fitness is bound to decline. Doesn't everyone's at the end of the year? Mine's plummeted.
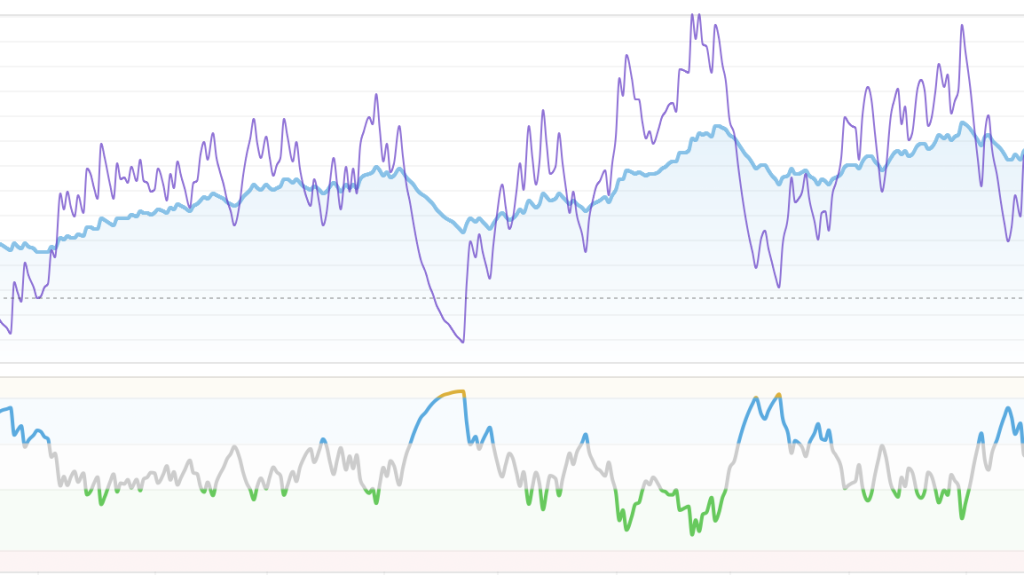
Here's mine:
Ten Under the Ben at the start of June took me well into the High Risk zone, which was part of my plan as my final big training ride for La Marmotte in the Alps at the end of the June. TUTB was my hardest ride of the year. Big gravel event late September and I've been steadily ramping up towards the Puffer in a couple of weeks time. That plan has been derailed by flu over Christmas (big dip at the end of the graph) which I am now over.
Some helpful pointers in here… I hadn’t realised your fitness score equates so closely to your average daily load. Makes sense, as at this time of year I do 4 x 1 hour rides averaging about 60, and 1 x 2 hour ride averaging about 100. That’s 340 weekly and my fitness hovers around 48 or 49. In the summer I add a couple of hours on to that (1 mid week and the weekend ride becomes 3 hours) and hey presto I get up to around 60! Occasionally fluctuations for holidays/events sickness, but I’ve been focusing on consistency and so 6 or 8 hours per week winter/summer respectively means steady fitness and no hi-risk moments. The downside of that, is that it’s clear I’d need a material lifestyle change to positively impact my fitness
I haven't read all of the above but how is fitness training load calculated? HR?
From your chart it looks like you worked harder in November. I’d also be intrigued to know what you had been doing before October to achieve that 100 (almost). Have a look in the Totals page on intervals.icu. That will give you total load over any period you care to enter, load by activity, time spent in HR zones, etc. etc.
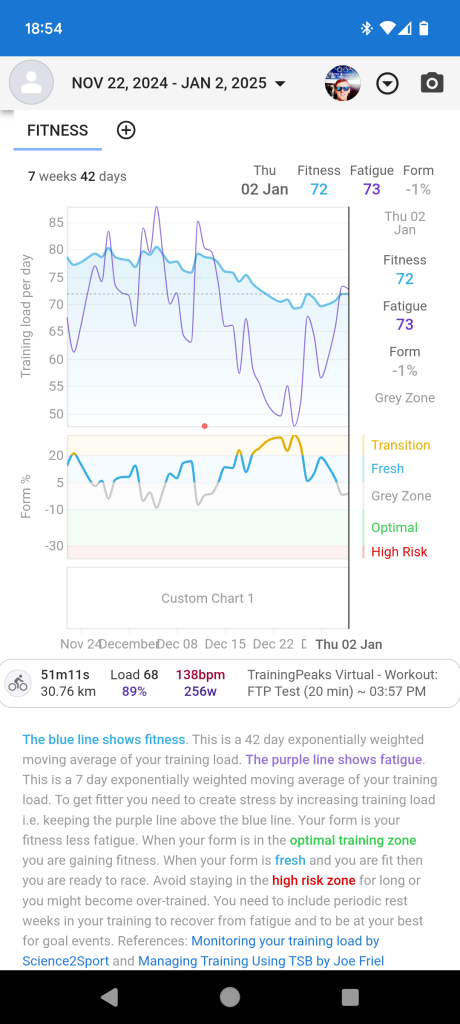
Good point. Taking a deeper dive into the data, I realized that some activities were double recorded - I have both a Garmin watch and Edge unit and started using both for a couple of rides when I got a pair of power meter pedals. I was deleting the duplicates in Strava and Connect but, it seems the duplicates still exist in Intervals.icu. Similarly, I had to manually upload IndieVelo rides to Connect (as Garmin won't allow auto-upload) and Intervals.icu was treating the Strava and Connect rides as separate. Either way, I've gone back and deleted any duplicates back to October and the results are less "peaky" (I'd post an image but the forum seems broken again and I can't post images at the moment - the chart now shows a peak fitness on 80. From Nov 19 to Dec 11, I managed to maintain 78-80 ish but there's been a gradual decline to 70-72 ish now.
Fatigue has see-sawed between 88 and 48 over the same period
I've also looked at the totals: Over the last 42 days, I've got 71 unique activities (41 hikes* and 30 rides [real world and turbo]), to give a total load of 2642
* Most of the hikes were gentle dog walks around the neighborhood - in reality, there will actually be more as I don't always record them all. I presume this is why I've spent 86% of my time in Z1 HR!
I haven’t read all of the above but how is fitness training load calculated? HR?
Primarily power data, but failing that off HR. Power is best. If you ride without either then you will need to manually enter an estimate for that ride so that it doesn't mess up the data.
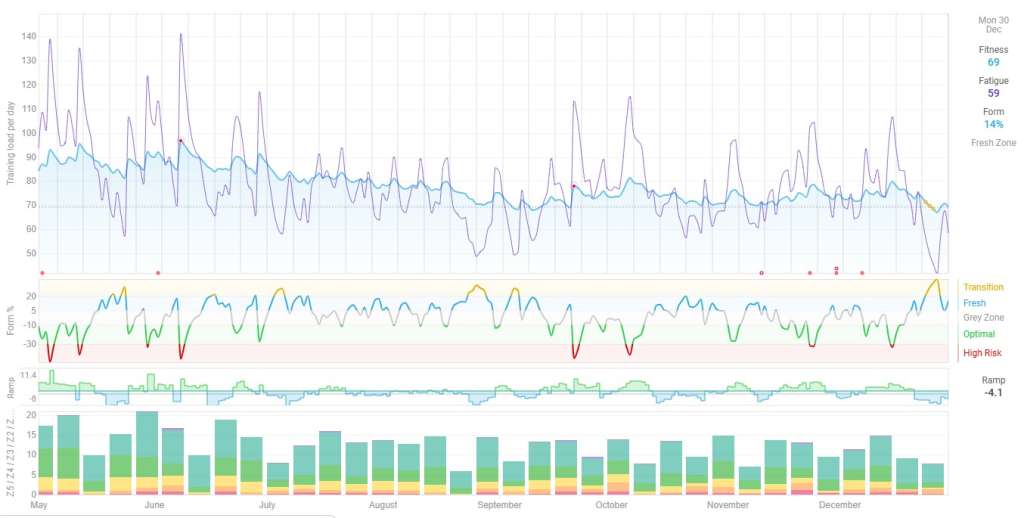
As an aside, here's my data from the last 3 months which shows the power of a concentrated block of training - in this case completing the Festive 500. I just ride for fun these days and as you can see my fitness was pretty steady between 40-45 back in October. From mid November it then declined quite badly because the weather was shite and I hate the turbo. Then I started getting back into it in mid December before completing the festive 500 in the last week, which cause my fitness to jump from 32 to 43 in just 7 days. Usually you would build that fitness over a few weeks - what I have done is effectively an intensive training camp style effort - but the point is, if you want to get fitter you have to keep increasing load (and therefore fatigue) without full recovery.
Here's a useful explainer on TSS and fitness score from trainerroad....not all TSS are the same, and just chasing a big tss number can result in overtraining
(Acknowledging that they are using this to justify their methodology)
https://www.trainerroad.com/blog/tss-what-it-is-what-its-good-for-and-why-it-can-be-misleading/
Hmm, well I'd like to see their proper analysis, but this notion of keeping purple above blue all the time doesn't seem a very good idea, as it means no rest, no hard/easy day training , and I think you'd plateau pretty quickly.
Another notion is that if this is done with HR, and you do get fitter, then your apparent load will reduce, especially if you aren't mixing things up a bitand just do the same workouts, but faster.
I think there's interesting data, and comparing 7 vs 42 day weightd data is interesting, but applying very simple rules might not be helpful
Hmm, well I’d like to see their proper analysis, but this notion of keeping purple above blue all the time doesn’t seem a very good idea, as it means no rest, no hard/easy day training , and I think you’d plateau pretty quickly.
Who has suggested that?
In the first post
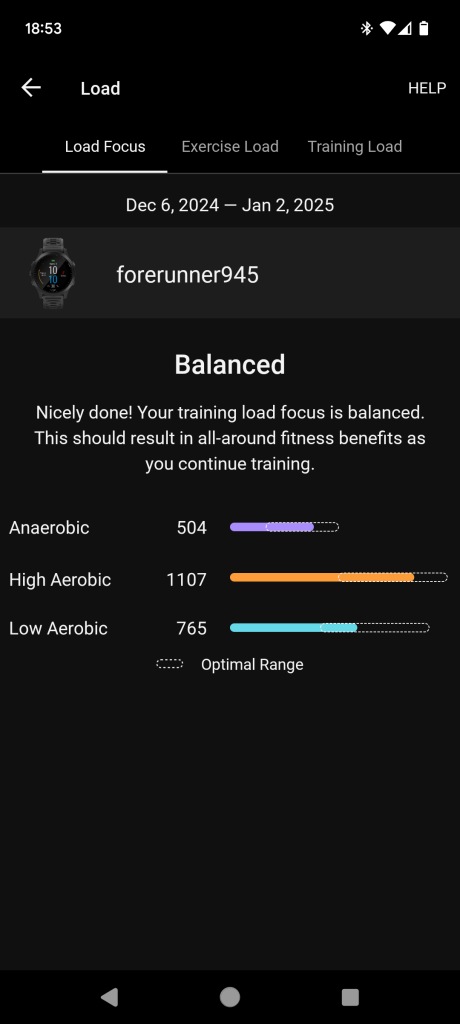
So I've done a couple of hard turbo workouts (one an FTP test) and intervals.icu fitness chart is showing greater fatigue than fitness, so my curve is heading in the right direction:
Garmin seems to agree that my workouts are Balanced and the load is in the optimal zone:
But Garmin seems my last workout as "Unproductive" (even though I managed a tiny bump up in my FTP...)
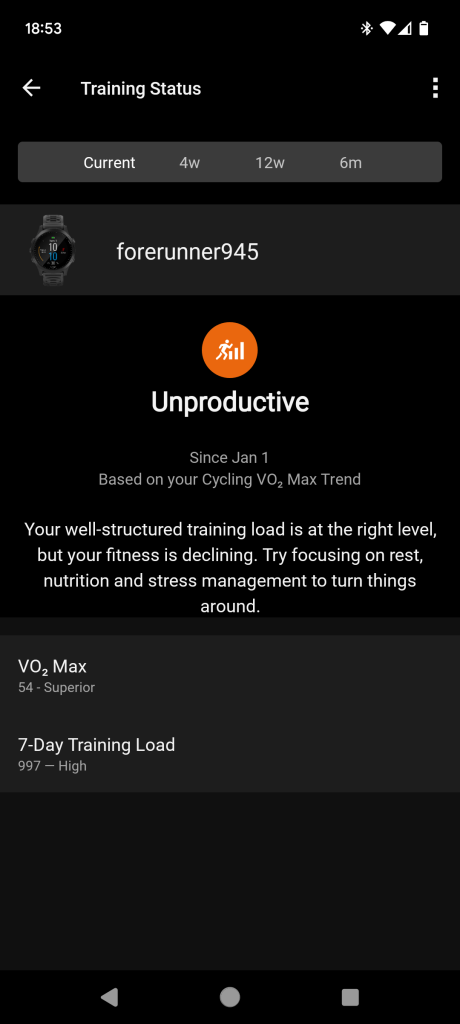
WTF!
Iirc intervals has two ways of calculating the load graph. For ages I could never get into the green for more than a blin when doing the same as a zwift team mate (who's intervals graph I can see). Turned out his was calculated differently based on a setting. Once I toggled that setting there was a lot more green and also patches of red that were a bit on the long side.