- This topic has 39,835 replies, 1,030 voices, and was last updated 2 weeks ago by Klunk.
-
The Coronavirus Discussion Thread.
-
EdukatorFree MemberPosted 3 years ago
Daily cases now higher than the total number of posts on this thread. 🙂
kelvinFull MemberPosted 3 years ago🙁
The latest data show 26,688 #COVID19 cases recorded overnight across the UK: https://t.co/QriQqqkyse
This is the highest number since the start of the outbreak.
Remember:
– Wash your hands regularly
– Wear a face covering where appropriate.
– Maintain social distance. pic.twitter.com/GzsmWBB0Wc— Public Health England (@PHE_uk) October 21, 2020
thecaptainFree MemberPosted 3 years ago@oakleymuppet , I’m interested in exploring the difference between a somewhat arbitrary curve fit (which I hope @TiRed won’t mind me characterising his method as) and my approach of fitting a simple epidemiological model. In essence I’m also fitting a curve, but the shape (family) of curves that I’m using are based on fundamental albeit simplified epidemiological dynamics which I think is likely to be better than just choosing a shape that looks roughly right. Especially when you extrapolate into the future.
Specifically, I believe his graph on p455 is far too optimistic. Sadly.
I may be misrepresenting TiRed’s approach somewhat in which case he may well respond…
oakleymuppetFree MemberPosted 3 years agoWhat curve are you using, I’m mildly statistically literate (I was achieving firsts in undergraduate level statistics). I do say mildly because I cut my studying short during Covid to help save the world (mostly because I want to go to actual lectures and life was getting in the way, but saving the world sounds better as an excuse in interviews). If you could humour me with further detail on the differences between your approaches, I’d be very interested.
TiRedFull MemberPosted 3 years agoTo a first order approximation, ie where there is little or no immunity, the methods are the same (it’s just that an exponential polynomial is easier to fit than a differential equation model – I fit those too btw). There are multiple data streams. I use the daily admissions data and the death within 28d by date of death. The statistical approach makes fewer assumptions but one reduces to the other with a chosen parameter set.
People are admitted to hospital with a periodicity. They tend to die on any day of the week. Early in the epidemic only reported deaths on a day was collated manually. Now date of death is also reported so you don’t see the big peaks and troughs due to reporting delays. The media eventually started to report 7d rolling means to remove the periodic effects.
thecaptainFree MemberPosted 3 years agoI’m using a fairly standard numerical model of the SEIR type which describes the progress of a disease through a population (assumed to be a mass of identical people, no accounting for different age groups etc). In reality it’s not much more than a (local in time) exponential curve but it has appropriate time lags and smoothings between changes in R parameter (the main free parameter in the model), infections, case detection, and deaths. Although the model itself is simpler than (and in many ways inferior to) those used by the likes of SAGE, this brings the advantage that I can fit the parameters to the available data using fairly advanced techniques that they don’t seem to know (or care) much about. Some groups like bsu are doing similar work but they aren’t quite as good as me at it:
kelvinFull MemberPosted 3 years agoThe media eventually started to report 7d rolling means to remove the periodic effects.
But that also lags. We’re acting too late, again, partly due to paying too much attention to “old” data.
TiRedFull MemberPosted 3 years agoRest assured kelvin, I use daily admissions data from up to the day before. The death data for the current week isnt included in the model. The lag is 7 days from admissions to deaths, so one has a week of future.
As for SEIR models, the simple ones are sufficient to describe national level just fine. The big question is;
Is the turnover in cases/admissions/deaths due to reduced contacts or increased proportion immune?
Various parameter combinations can give an apparently similar conclusion. One Nobel prize winner believes the latter, having discovered the Gompertz equation and Tcell cross reactivity. The simple SEIR model, monitoring R for seropositives does not support that view.
Then there is the timings and what R does After such changes. We’ve had five changes since March 23.
BillMCFull MemberPosted 3 years agoThat article from thecaptain is suggesting a daily infection rate of 53k and doubling in ten days whereas the government’s saying 26k daily positive tests. Given the effectiveness of track and trace, that’s a rather disturbing disparity.
TiRedFull MemberPosted 3 years ago“the advantage that I can fit the parameters to the available data using fairly advanced techniques that they don’t seem to know (or care) much about”
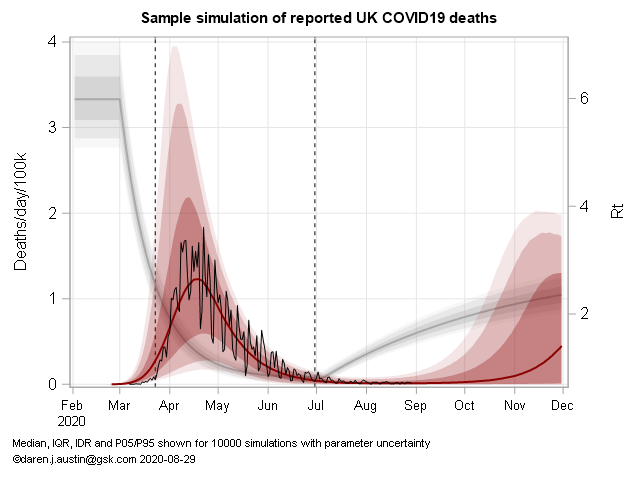
Go on, I’m interested – For SEIR models, I use random space sampling with an optimization based on an assessment of RMSE as a measure of fit. Then simulate accordingly with parameter uncertainty and estimate median and prediction intervals from 10,000 samples. Many others use likelihood methods, better ones assume Poisson or negative binomial likelihoods.
Timing of interventions, their magnitude and speed of onset, is more challenging than age- and regional structural aspects. Here’s one example with the older Deaths data. I have a simple model with changes in R taking some time to take hold. IFR, R and incubation period are all nuisance parameters with correlations:
 thecaptainFree MemberPosted 3 years ago
@TiRed, my approach is fundamentally based on the standard Bayesian updating paradigm with likelihood based on model fit (which is pretty much equivalent to minimising RMSE in log space). The particular novelty of my work is that my iterative Kalman smoother is very efficient in high dimensional applications meaning I can fit a model which has daily increments on the R value (ie ~250 parameters, in fact I have another 250 params for the case ascertainment ratio which also varies in time in a similar manner, so 500 in all). The R time series is vaguely similar to the BSU plots though they seem to be using weekly piecewise-constant R values meaning 20-30 parameters. I suspect they are using a more common MCMC approach which is very general and widespread but less efficient and can’t handle so many parameters as my method. I tried that initially and also got stuck at the level of weekly R values. The iterative Kalman smoother is something I developed 15 years back in another context, it’s rather fortuitous that it happens to work so well here.
I don’t think the difference in our results is really due to number of parameters though. This sort of thing has been literally my research career for the past several decades, and it just seems they aren’t quite as good at it as I am. It was obvious at a glance that their previous forecast was very high and their new one is a radical correction. I find it concerning that I’m so easily able to improve on the forecasts of people who are advising the government. Like you, I’m only doing this as a hobby in a bit of spare time.
thecaptainFree MemberPosted 3 years agoThis is an example of what I produce on a daily basis:
It suddenly strikes me that 26k positives, with an assumption that the true number of infections is some modest multiple of that (nearly 3x in my model), is not really all that far away from the putative daily peak of about 250k infections first time round. pic.twitter.com/nSCOXsIJvh
— James Annan 🇪🇺 (@jamesannan) October 21, 2020
benpinnickFull MemberPosted 3 years agoI’m not going to pretend to understand the above, but I do know statistics are only as good as the input data. Having experienced the ‘testing’ facilities we’re paying billions to SERCO to provide, I hope you’re allowing for significant levels of false negatives if the calculations you’re using require the use of both positive and negative test results!
TiRedFull MemberPosted 3 years agoI suspect they are using a more common MCMC approach which is very general and widespread but less efficient and can’t handle so many parameters as my method.
They are. With relatively strong assumptions about parameter spaces. I like your approach of case ascertainment and R as relatively free parameters (but R probably has some time for change too rather than falling off a cliff as the Govt would wish). The model can then try and infer local (in time) values of R and ascertainment. Both R and testing (ascertainment) are nuisance parameters in the model. I gave up on cases a long time ago. Now they basically tell you which areas have a university!
On a technical point, people have an inconvenience of being integers, so when numbers get low, distribution assumptions become important – hence Poisson or negative binomial distributions of some form are needed – you see this at the regional level for deaths in particular. The SEIR models being used are individual-based in that they count in integers and transition them from state to state after some time dependent on a distribution – normally Weibull rather than exponential (as per normal ODEs). Then one needs to run 10,000 runs to estimate prediction intervals.
The statistical method for local regression is spline fitting. That’s also been done by PHE group on their survey data. To be perfectly honest, 30 years of modelling (5 doing epidemiology, and 20 doing non-linear mixed effects) has left me more disillusioned with mechanistic models and more enamored with statistics. It’s not Physics and one should not pretend it is.
i_scoff_cakeFree MemberPosted 3 years agoIt’s not Physics and one should not pretend it is.
Positivism was fashionable in the 60s in fields such as social sciences, economics etc. It was thought that with enough parameters human behaviour could be reliably predicted as you say mechanistically and deterministically. Everyone was looking for iron laws. Theoretical foundations for this can be found with Spencer, Comte, etc. It’s generally been abandoned for more modest modelling using statistical methods with acknowledged limited generalisability. Anything involving human behaviour seems to resit being understood like physics.
frankconwayFull MemberPosted 3 years agoTwo PhDs having a difference of opinion about statistical analysis and forecasting – that must be the pure essence of this forum.
jam-boFull MemberPosted 3 years agoThey’re both wrong. In a while we’ll see who was the least wrong…
dyna-tiFull MemberPosted 3 years agoweeks of medical warning of a 2nd rise, to which our fat useless PM says ” Lets put the schools back and colleges/unis too.
Surprise surprise were now in a worse state than March.
SO.
Knowing of a 2nd rise, yet still sending kids back it appears they want the virus to spread slowly. It appears given that dumbo move they want the virus to infect everyone and whomever survives survives.
But they need to do it slowly so as not to overwhelm the services.Tell me Im wrong. Logic is something us Aspies have and this entire mess stinks
oakleymuppetFree MemberPosted 3 years ago@TheCaptain – can having so many parameters in your model risk misspecification/bias of some kind? What’s the probability of your model being correct by chance? What does having 200-500 parameters achieve?
I need a day of googling to properly digest both yours and TiReds posts, so be patient with me – I’m essentially an idiot undergrad when it comes to stats.
several decades
You a 90 year old quant? 😀
martinhutchFull MemberPosted 3 years agoThe fact is, they are set to squander the natural fire break opportunity that half-term gives us. The schools are out already, so why not make it a bit longer and shut everything else for a couple of weeks to try to minimise mixing?
All they are offering is a slow grind into Tier 3 for everyone, where they will remain well past Christmas.
The tragedy is that following the SAGE advice – remote learning for unis in term 1, firebreak lockdown – would most likely be far less economically damaging than this.
i_scoff_cakeFree MemberPosted 3 years agoThat’s me too. A little stats knowledge from university but not a lot.
With so many specified parameters in a model, I’d be concerned about overfitting.
That’s my 2-pence intelligent comment. 🙂
kelvinFull MemberPosted 3 years agoAll they are offering is a slow grind into Tier 3 for everyone, where they will remain well past Christmas.
I’m afraid so. Grim. I’d at least have some respect for them if they were preparing the public for this… it’s going to get messy when people paying less attention work out what they are being walked into.
The tragedy is that following the SAGE advice – remote learning for unis in term 1, firebreak lockdown – would most likely be far less economically damaging than this.
This. This. This. Too late now though. The damage is coming, with very limited help for those hit hardest by this policy decision.
TiRedFull MemberPosted 3 years agoThey’re both wrong. In a while we’ll see who was the least wrong…
The truth is, there will probably be an intervention before the end of the prediction interval. So I hope I am wrong! I think the government were holding out to get to half-term, then have some form of harder lockdown when the schools were out as a homage to March. Things seem to have grown a little faster and the North is running away. The South will follow but will likely feel the earlier effects of intervention.
If you want a rule of thumb, the epidemic declined at 3%/day and is now increasing at 5%/day. So you need about 5 days of lockdown to win 3 days of growth. It was 21 days of lockdown to win 3 days in March, so be thankful for something.
oakleymuppetFree MemberPosted 3 years agoThat’s me too. A little stats knowledge from university but not a lot.
With so many specified parameters in a model, I’d be concerned about overfitting.
That’s my 2-pence intelligent comment.
Hah! I’m still trying to learn, which is why I’m asking what are probably fairly thick/idiot questions, it’s just life got a bit in the way of converting from the biosciences to stats. 🙁
I do like a good argument as well though – that and I think stats is rock and roll – which get’s me horrified/weird/disturbed looks even amongst biologists and chemists that look like they’ve been chained up in the basement of some dark establishment building for the past 30 years.
GribsFull MemberPosted 3 years agoKnowing of a 2nd rise, yet still sending kids back it appears they want the virus to spread slowly. It appears given that dumbo move they want the virus to infect everyone and whomever survives survives.
But they need to do it slowly so as not to overwhelm the services.That’s always been the case. The only alterative is eradication that I don’t believe they’ve even suggested they’d pursue that. The hope has always been for a quick vaccine or improved medical treatment to maximise NHS capacity. Our government is at best incompetent and at worst corrupt so we’ll end up with massive short term deaths from covid, and longer term problems from the economic and social damage.
I personally fundamentally disagree with lockdowns but don’t deny that a comprehensive (much harsher than we’ve had before) one of 2-3 weeks would reduce the number of deaths over the next few months. Long term would be a different matter but that could to a degree be mitigated with the right support.
reluctantjumperFull MemberPosted 3 years agoTo add a bit of light-heartedness to this thread for a few seconds I have a wee little story:
Went to my parent’s house to help out with moving my dad’s bed etc from the 2nd floor down to the 1st so that he didn’t have to walk up so many stairs. Got chatting to one of the neighbours while I was leaving (socially distanced, over the fence) and we were discussing the projections for how bad it would be through the winter etc. This neighbour is one who likes to read everything online and has a habit of believing crackpot theories etc, you know the type, but is otherwise a sound person and has been invaluable in helping me keep an eye on my parents while I’ve been unable to visit due to restrictions, work etc. Anyway, I mentioned that I read this incredibly informative thread on here and it had given me a good understanding of the bigger picture due to the expertise shown on here from a few posters. He tried to shoot me down saying that no-one on a silly bike forum would have a clue and that I should seek out the reports produced by X,Y and Z people, they knew what was really happening. He was rather shocked when I told him that expert Y was TiRed on here! He’s probably reading this thread right now so all I’ll write is “Hi John!”.
Made me giggle anyway and right now any giggle is worth sharing. Back to the serious stuff now.
TiRedFull MemberPosted 3 years agoI personally fundamentally disagree with lockdowns but don’t deny that a comprehensive (much harsher than we’ve had before) one of 2-3 weeks would reduce the number of deaths over the next few months.
Probably about the most honest view I’ve read. Thanks. And I do frequent lockdownskeptics for balance. It’s also one I have some sympathy with actually. As I have always said, there are no good choices here. None. But honesty in decision making over balancing education, economy, healthcare provision, and the likely consequences of actions should be at the fore. I don’t personally think we’ll achieve anything better than we did in March. We’ll buy two weeks of growth, which at the moment is roughly a half of deaths, or some fraction of healthcare provision for routine treatment, operations and cancer clinics. It’s not a long-term strategy…. Get to Christmas…get to half-term… repeat till vaccine.
Hi John.
kelvinFull MemberPosted 3 years agoI think the government were holding out to get to half-term, then have some form of harder lockdown when the schools were out as a homage to March.
I used to think that… but… why go through all the current mess of getting regions into “Teir3” just before announcing a different approach based around greater restrictions and an extended half term? I don’t think it’s coming now, even though it should be. Up here, regions are going into Tier3 as half term starts… you may have later half terms there, I dunno.
TiRedFull MemberPosted 3 years agoBTW this is the only social media outlet I post on on the subject in any depth depth. I have twitter and FB, but don’t find them constructive – I barely read them actually. And only post public domain information. Work means I don’t comment to the media at all. You are welcome to take whatever you wish. But you get what you pay for. So if it’s helpful get a “P” if you haven’t already. 😉
oakleymuppetFree MemberPosted 3 years agoGet paper? Get a pimp? Get a polo neck? 😀
I is confused. Can I apply for permission to access your work?
But cheers TiRed, your posts are really interesting. We do appreciate it, don’t worry we understand that NDAs limit what can be talked about.
Genius. Gonna be a meme if we’re not careful
Am I out of the loop on /r/dankmemes or something?
yourguitarheroFree MemberPosted 3 years agoI’m assuming the government is planning to move every region into tier 3 (possibly leaving out one small area like the Isle of Wight) so that while there is effectively a a national lockdown, there technically isn’t one so they don’t need to do furlough again. It’s all sophistry and semantics to these chuffs.
martinhutchFull MemberPosted 3 years agoso that while there is effectively a a national lockdown,
It’s identical to March’s lockdown except for most of the pubs (which serve food) being open, plus schools, shops and workplaces, and the ability to travel from town to town. Plus any variations negotiated with your local authority, such as gyms in Lancashire.
Tier 3 has been widely acknowledged to be insufficient to reduce R to less than one, so all it will do is most likely freeze transmission at the point of application. Which, in the case of most of the areas put in so far, is a high rate.
When you go into Tier 3, there is no plan to get you out of it any time soon.
mrmonkfingerFree MemberPosted 3 years agoI’m eagerly awaiting the arrival of Tier 4, the one that actually gets R down so that a region can come out of not-quite-lockdown…
Didn’t we used to have five levels at the start of this? Varying from what might be tier zero up to something just beyond tier 3 (4!?)??
scotroutesFull MemberPosted 3 years agoLooks like Scotland will have five tiers. Let’s hope they cover that scenario.
kelvinFull MemberPosted 3 years agoDidn’t we used to have five levels at the start of this?
For about a week. But then it looked like far too much work to do go down the tiers… as moving between tiers in the way the government had set out involved actual delivery of the means to do so, rather than 5 mins of table bashing by the PM in a pre-recorded piece to camera.
TiRedFull MemberPosted 3 years agoI is confused
P was for Premier account – but now it’s Blue I think? Anyway if you’d like to say thanks buy a subscription. They need it.
Tier 4, the one that actually gets R down
That’s the schools closed. You Buy (Tier) 3 and get one free during holidays. Limited offer only.
binnersFull MemberPosted 3 years agoUnbelievably, Serco’s test and trace system continues to get even worse
Surely, with figures this low, the whole thing is just a complete waste of time and money? It’s just completely ineffective if only just over half of contacts are ever being reached?
What an utter and complete shambles!
reluctantjumperFull MemberPosted 3 years agoIt’s Serco, they don’t know how to make things better.
I’m guessing someone has figured out that they get paid the same regardless of whether the Trace bit works or not so just do loads of the Test bit and watch the money roll in.
kelvinFull MemberPosted 3 years agoCan you summarise the Oxford-AstraZeneca vaccine news for us lay people please, TiRed?
You must be logged in to reply to this topic.