- This topic has 1,329 replies, 87 voices, and was last updated 13 years ago by molgrips.
-
It's global cooling, not warming!
-
rightplacerighttimeFree MemberPosted 14 years ago
Junkyard – how do we validate, calibrate and interpret the patchy atmospheric/ocean data?
Yep, we compare it with the most complete records we've got – the surface record.
how do we calibrate and interpret the satellites?
Yep, you guessed it!
House of cards!
Z11 – Now you are talking complete crap.
You think that satelites, are calibrated against the historical data set?
How would that work then?
Surely they would be callibrated in real time against very carefully made measurements taken by the institutions that launch them?
crankboyFree MemberPosted 14 years agogosh this is fun Hainey.
The point of my last post was intended to be simple: you can't say future predictions are rubish if they are based on models and then use data based on models of past climate as sound evidence to contadict the predictions about the future . The use of models is either a good tool or a bad one . If you can actually show a defect it a particular model that is a different argument, which you have yet to advance.
I'm not actually challenging the historic data you have refered to however i do challence the conclusions you and you alone draw from it. You have the conclusion from the source of your graph which contradicts your interpretation of the graph.
I do actually enjoy learning from history so far I have learnt that you do not deal with any direct question . Please for the sake of my sanity ,the quailfied scientists who drew up the ice core data think man made climate change is an issue.The geologists think the world orbiting the sun and spinning on it's axis erratically is a cool theory but does not fit all the sedimentary data available, the climentologists think that erratic cycle is a good theory and does account for cyclical heating and cooling,but the changes are gradual, so that "natural cycle" does not account for current climate change.
You apear to suggest different interpretations of this historic data , what is your qualification? I ask only because your proposition contradicts that of those whose qualifications are known. If the area of dispute is really the interpretaion of data then i think that qualifications are relevant when one asks oneself whose interpretation is likely to be best.Zulu-ElevenFree MemberPosted 14 years agoZ11 – Now you are talking complete crap. You think that satelites, are calibrated against the historical data set
Where the hell did I say historical? I said the most complete data set!
The satellite baseline point is calibrated by comparison between radiosonde measurements, which produces a tropospheric temperature calculation, this is then analysed into usable data by comparison with surface records.
As we only have approx 30 years worth of satellite data, and prior to that a small set of atmospheric records taken by weather balloons in a limited number of locations. to draw any conclusions for more than 30 years, you have to link that data against surface records, in the same way that the ice core proxy data has to be calibrated against the surface record.
Crankboy:
the quailfied scientists who drew up the ice core data think man made climate change is an issue.
Serious question, did they think that before they analysed the data?
By that I mean, was the conclusion drawn from analysing the data, or did the data support the thesis – its an important scientific distinction!
m_cozzyFree MemberPosted 14 years agobrrr cold today. must be this 'global warming' rubbish I hear about of the tv.
rightplacerighttimeFree MemberPosted 14 years agoNow you are talking unintelligable complete crap.
If you can't beat them with brilliance….
Of course it's not the complete data set.
Satellite calibration is done V actual measurements taken at the time the satelite measurements are taken.
Or in this case V an on-board stable calibration target.
Zulu-ElevenFree MemberPosted 14 years agoAgain, read the words – I said
the most complete data set
not
the complete data set.
I do try and choose my words carefully!
The on-board calibration target still has to be cross referenced with a baseline, otherwise you're left with pretty much useless set of 30 years worth of data that bears no relevance to analysis of global temperature changes over any period longer than the satellite record.
As your own link says:
For instance, since there have been ten successive satellites, most of which had to be calibrated to the one before it with some non-zero error, there is the possibility of a small ‘random walk’ component to the 30+ year data record.
so, by their own admission, the data calibration is unreliable with an unascertained level of error.
crankboyFree MemberPosted 14 years agozulu eleven "Serious question, did they think that before they analyised the data?" fair point 'experimenter bias' is always a consideration the hainey graph appears to date to 1999 so i can't really answer your question easily , but given the apparent unanimity of scientific opinion (97% of specialists in the field 87% of scientists in other areas) it may be fair to assume some expectation as to out come on their part . On the other hand at the time the administration in the USA and the oil company's were massively anti man made climate change and funding a knocking campaign so one would imagine the figures and conclusions would have been debunked if 'experimenter bias' had tainted them. British Antarctic Survey (2004, June 11) which deals with the worlds oldest ice core again seems to accept global warming as man made, so we end up either with nearly all scientists are wrong and the Russians the media and the man down the pub are right or maybe there's something in these worries after all. ("the Russians" is a spurious reference to climategate 2)
JunkyardFree MemberPosted 14 years agodont worry I have the graph ready if they really mention the russian cherry picking data lie.
Z-11 much of what you say, measuring error and expectation can be labelled against most/all of science. I doubt anyone really investigates things they dont believe at all – moon cheese will have few studies for example.
However I doubt someone one day said I know lets come up with global warming now lets start a conspiracy and start forging evidence. There would have been a starting point when climatologists were just gathering data to see where it led. Once it suggested certain things we investigated them – this seems an entirely sensible approach unless you suggest we just pull out random hypothesis[what is the plural?} and just test them. I mean the great haderon collidor has not been built just to see what will happen but that does not mean they will forge the data for the higgson-boson particle …..they are scientists not Tony Blair with a dossier.rightplacerighttimeFree MemberPosted 14 years agoZ11
so, by their own admission, the data calibration is unreliable with an unascertained level of error.
You're almost stooping the the hainiesque "prove it" level of argument
I wonder why they bothered launching another nine satellites after the first one? Maybe they just didn't spot the flaw you did in their thinking and they thought that measurements with "an unascertained level of error" might still be worth something? That was a few billion wasted then wasn't it?
I see what you mean now by complete data set. You mean geographically widespread? Does that matter? Presumably nowadays we can take pretty accurate temperature measurements without making errors such as painting the sensor box with the wrong sort of paint? In which case, how many calibration points are needed?
haineyFree MemberPosted 14 years agoThe use of models is either a good tool or a bad one.
You can't determine either way until you have proven the model. So at the moment it is just a prediction right?
If you can actually show a defect it a particular model that is a different argument, which you have yet to advance.
I haven't professed to any defects in models, just to what i stated above. The issue i have is that scientists could, and unfortunately have, manipulated data to swing data to suit their own needs.
I'm not actually challenging the historic data you have refered to however i do challence the conclusions you and you alone draw from it. You have the conclusion from the source of your graph which contradicts your interpretation of the graph.
Not true, i have merely posted a graph which in many peoples opinion shows a cyclic trend over a historic period. The conclusions i draw are shared by many more in the scientific community
Please for the sake of my sanity , the quailfied scientists who drew up the ice core data think man made climate change is an issue.
Wrong, some do, some don't.
The geologists think the world orbiting the sun and spinning on it's axis erratically is a cool theory but does not fit all the sedimentary data available
Wrong, some do, some don't
What is your qualification?
As discussed previously, not important, a lot of people have professed to be more knowledgeable than me, they could be right, the could be wrong, or they could be 16 year old nigerean scammers for all i know.
I ask only because your proposition contradicts that of those whose qualifications are known.
Wrong, it does for some, doesn't for others.
If the area of dispute is really the interpretaion of data then i think that qualifications are relevant when one asks oneself whose interpretation is likely to be best.
I have never said that i am right, that is the problem you have. Unfortunately i have dared to question the greater good and that is unacceptable. Like a lot of religion i need to have it rammed down my throat until i become a believer!
Why do you struggle to debate in a manner other than screaming down other peoples opinion? Its sad.
Junkyard, glad you have found a friend to play with!! 😉
Zulu-ElevenFree MemberPosted 14 years agoRightplace – sure, we can make very accurate measurements now – but it remains very difficult to compare that data reliably with older, less accurate data – when we're looking at trends over a couple of centuries worth of data, we have to consider the serious risk that the level of error exceeds the level of variance in the global temperature anomaly.
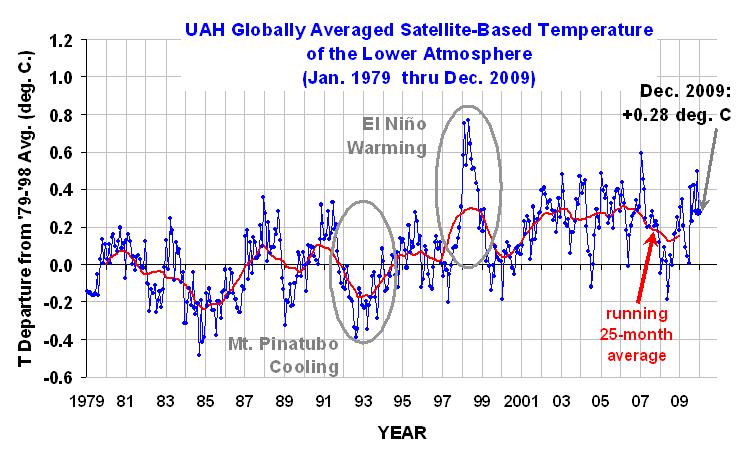
We can probably say that the records for the past twenty, maybe thirty years of satellite data are fairly accurate, but by their own admission not entirely.

Nte that that only goes back to 1979 – It does not attempt a comparison with the historical record, this is pure satellite data – to connect the two, you'd have to try and cross reference with a baseline from the land record:
So lets compare that with the surface record:
orNow, just at a cursory glance, I'd say that indicates that the pure satellite data indicates a much lower curve than the surface record!
*I'd call this a significant issue – the two sets of entirely separate data don't appear to indicate the same level of drastic temperature change*
Of the available data sets, I'd say the *pure* satellite data is the one that I'd prefer to rely on, purely due to the fact that I'm aware of known issues with the correction logarithms applied to raw data from surface stations!
and to make it really meaningful, we'd need to compare the 30 years of accurate satellite data with the historical proxy data, validated against the surface record:
Basically – does the last 30 years of satellite data tell us anything
Zulu-ElevenFree MemberPosted 14 years agohttp://www.woodfortrees.org/plot/uah/from:1979/trend/plot/gistemp/from:1979/trend
Here we are – two data sets plotted against each other – surface and ocean data versus satellite only records.
I've just managed to reduce global warming over the past 30 years by about a third! That indicates that theres a significant warming bias in the surface record over the past three decades.
JunkyardFree MemberPosted 14 years agoNot true, i have merely posted a graph which in many peoples opinion shows a cyclic trend over a historic period. The conclusions i draw are shared by many more in the scientific community
Please feel free to number/quote each of these and answer in turn
1.The authors conclusion does not support your view does it?
2. The scale for the graph is not large enough to include current levels of C02 is it?
3. Current levels of C02 are at a 650,00 year high aren't they?
4.The graph ended in 1950 and therfore it has no bearing on the current situations does it?
5.Is the cycle still a valid/credible explanation ?
6.If yes why?Junkyard, glad you have found a friend to play with!!
It would appear a number of people have disagreed with you and agreed with me. If that is how you wish to judge it then the evidence does support the view that I have many friends and you walk a lonely path. 😉
Z-11 If you want to compare graphs you need to standardise the axis there areconly two graphs – the first two where any axis scale is the same – If you want to post up comparison graphs can they actual use the same scale?
Now, just at a cursory glance, I'd say that indicates that the pure satellite data indicates a much lower curve than the surface record!
Well you are CORRECT but you are comparing surface land temperature with atmospheric temperature. It is hardly revolutionary news to suggest there are different rates. What next are you going to show us that there is a difference between the land and the sea temperature rise?
JunkyardFree MemberPosted 14 years agothe difference between satellitte measures and actual sea thermometer measures is is also well documeneted
The data used here is based on analysis of Advanced Very High Resolution Radiometer (AVHRR) satellite images in the thermal infrared channel available as grey scale photographs with 4 kilometre pixels. These are converted to temperatures using a calibration scale. A crucial feature of the analysis is that it is done by a human observer who selects regions which appear to be completely cloud-free (J. Clarke, NOAA, personal communication). This is critical, because the presence of clouds in the pixel contaminates the sea surface temperature signal with the lower values characteristic of cloud tops. Large clouds, such as those associated with weather fronts, are readily visible in the images and avoided, however the major problem is the possible presence of sub-pixel size clouds which cannot be seen in the images, but which are nevertheless capable of adding a spurious signal. This is especially a problem in the tropics, where clouds tend to be small. Human judgment is used to identify those pixels which are likely to be clear because their temperatures represent a consistent regional maximum background value. There is always a finite, but small, chance that all such pixels may be subject to hidden contamination from widely dispersed small clouds, which would tend to result in an underestimate of the true value
so we have human error and a technical reducing problem not present with an actual thermometer but it does allow us to better measure large areas such as the Pacific Ocean.
Zulu-ElevenFree MemberPosted 14 years agoSo global temperatures are rising at a higher rate on land than in the atmosphere?
When atmospheric CO2 is supposed to be the driver of the change…
😯
Your explanation of the difference between records does not explain why there are differential rates of warming, one is climbing faster than the other!
Edit – go and read these comparisons:
A comphrehensive comparison of GISS and UAH global Temperature data
If the surface temperature record is believed, the temperature anomaly is rising at a higher rate in some places than others.
The wood for the trees link plots the two sets of data perfectly one against the other!
Can you not see, that a perfectly valid conclusion from that, would be that the "value added" land temperature record may be exhibiting some form of bias that is not evident in the satellite records!
haineyFree MemberPosted 14 years ago1.The authors conclusion does not support your view does it?
I don't know, i haven't read the article, i lifted the graph directly from the web to highlight the cyclic nature that people were shouting for evidence of.
2. The scale for the graph is not large enough to include current levels of C02 is it?
No.
3. Current levels of C02 are at a 650,00 year high aren't they?
Maybe, maybe not, depends on the accuracy of the historical data which you don't believe. As eluded to before there is the potential that we are in a spike at the peak of a cycle.
4.The graph ended in 1950 and therfore it has no bearing on the current situations does it?
There you go again, not wanting to learn from the past. It has every bearing on today and the future. Plus if you think that 50years in a 450000 timeline is a good measure then you need to think again.
5.Is the cycle still a valid/credible explanation ?
Yes
6.If yes why?
Because the data set is used in building are predictions. Technically over the next 50,000 years or so we should be having a global cooling. Who are you to say that this won't happen? Seeing as it HAS happened in the past. I am not saying you are wrong, thats the mistake you are making, i am just asking why you think you are categorically right?
What is your prediction for the next 50,000 years?
What are you basing this on?
Why?Glad you have managed to find some friends on the internet!!! 😉
crankboyFree MemberPosted 14 years agohainey:i'm impressed that you are still playing but disapointed that you have not responded to the graph challenge post the ice core data with a decade based time line extend that to model current and future tempreture superimpose the available actual tempreture records and see if the reality matches the model extrapolated from the ice core. Short answer it doesn't there is a rapid and sudden spike which is why the people with qualifications are worried , and it's a scarry rapid planet changing spike which is why the people with out qualifications are desparate to latch on to any argument no matter how stale and discredited to undermine the scientists .
me: "Please for the sake of my sanity , the quailfied scientists who drew up the ice core data think man made climate change is an issue."you:"Wrong, some do, some don't."
you: "don't know, i haven't read the article, i lifted the graph directly from the web to highlight the cyclic nature that people were shouting for evidence of."
PLEASE Name one qualified scientist who currently does not think man made climate change is an issue or who belives that the current tempreture rise is due to the natural cycle postulated from the ice core samples?By the way i was actually originally pointing out that the person whose graph you used does not think it shows what you cliam it shows.me "The geologists think the world orbiting the sun and spinning on it's axis erratically is a cool theory but does not fit all the sedimentary data available"
you"Wrong, some do, some don't"
PLEASE name one geologist who argues that the Milankovitch cycles fit all the sedimentary data currently available.
I'm not actually seeking to shout you down, it is in my intrests and every one else's best intrests for you to be right we can evolve or develop our way through one of the very gradual Milankovitch cycles but we are almost at catastophic tipping point on the Man made global warming model.
haineyFree MemberPosted 14 years agoCrankboy, it may be a spike, yes, i agree with you, but similar spikes have been seen before, and yes according to ice core samples CO2 is slightly higher than historical highs, but why has the average temperature not increased more as a result, and why does the average temperature actually match those historical values?
In the past, historically, where man has had NO influence whatsoever, temperature of the planet has increased closely followed by CO2 levels. Then, it has dropped back down again. Why are you so closed off to thinking that this won't happen again?
but we are almost at catastophic tipping point on the Man made global warming model
or we are at the peak of cycle that we have seen before. Its impossible to tell.
crankboyFree MemberPosted 14 years agohainey i think we are nearly there to your credit you moved from "historical ice core reccords are fact" to understanding that they are a model based on extrapolations from data (ie the thickness and composition of ice on an area that covers less than a sguare foot over a very long time) Now look at the time line on the graph you post see how it is compressed to enhance the aperance of the up's and downs ?(this is to make it easy to see links or mirrors between co2 and temp) place your tempreture measurment against a more natural unit of time for our current debate say decade instead of melennia, you previous Spikes vanish from the graph and become gentle rolling hills and valleys .But the current spike stands!! hence the worry.
We have released into the atmosphere co2 stored over melennia in coal oil and peat plus that stored over hundreds of years in trees, whilst destroying huge tracts of natural co2 scrubbers in the form of rain forest. We have done this in a sudden couple of hundred years do you honestly belive this would be free of imopact on the biosphere?
EdukatorFree MemberPosted 14 years agoWhat's wrong with off-setting when it's based on sustainable development? If Google chooses to produce more power that it consumes using sustainable, renewable sources where's the problem? If a company plants trees to match it's paper consumption who loses? The only dodgy one is buying up rain forest as unless you buy all of it you will only influence where trees are cut down not how many.
Simmer a pan of water Hainey and measure the temperature – about 100°C depending on how high above sea level you live. Now cover the pan with a glass plate and watch what happens. The temperature doesn't change but the pan gets very stormy. {Play nice – Mod}
Natural systems incorporate natural buffers.
haineyFree MemberPosted 14 years agoWith luck a climate change provoked extreme weather event will destroy your home and leave you severely handicapped for life
Christ almighty are you 5?
Oh, and it shows that you know very little when you say i will need to wait 100 years to see the evidence!
EdukatorFree MemberPosted 14 years agoOh, and it shows that you know complete F*CK all when you say i will need to wait 100 years to see the evidence!
Read again, I didn't say that. You're seeing some of the evidence now and will see a lot more if you live longer. You won't though, as even if you survive climatic change you'll get wiped out oil declines and the fabric of society breaks down.
Interesting that you should call on God. He'll have you too at the pearly gates. It's hell fire for you for destroying the nice planet God gave you. I'm safe as I don't need a God.
EdukatorFree MemberPosted 14 years agoPot – kettle – black. Besides I'm not hungry Hainey. There again a Hainey for lunch might be good.
midgebaitFree MemberPosted 14 years agoDoes that mean I need to find another excuse for not going for a ride?
Zulu-ElevenFree MemberPosted 14 years agoSnow's really melting now
Yep, and just think what all that meltwater is going to do to sea levels!
http://www.larouchepub.com/eiw/public/2007/2007_20-29/2007-25/pdf/33-37_725.pdf
TimFree MemberPosted 14 years agoWhat's wrong with off-setting when it's based on sustainable development? If Google chooses to produce more power that it consumes using sustainable, renewable sources where's the problem? If a company plants trees to match it's paper consumption who loses? The only dodgy one is buying up rain forest as unless you buy all of it you will only influence where trees are cut down not how many.
By offsetting we were talking about offsetting schemes – not directly generating power
My main doubt with offsetting schemes is that it doesnt invoke any behavior change…and the best you can hope to get is neutral – e.g. no active reductions.
EdukatorFree MemberPosted 14 years agoHello Mr Mod. Will do.
It is a interesting point though that as flood waters rise higher and storms increase in strength and frequency some people refuse to believe that their own actions could be in way contributing. As 4X4s disappear under the rising water I can't help but rejoice in the poetic justice. Sadly the weather is not as selective in choosing its victimes as I would like.
ahwilesFree MemberPosted 14 years agoHainey, i watch debates like this with genuine interest;
(why do people with little or no interest in any other field of science feel the passion about AGCC? – the world is full of interesting scientific research, why pick this?)which of the following statements would you disagree with:
1) CO2 is a greenhouse gas.
2) human activity is increasing the amount of CO2 in the atmosphere.
3) tinkering with the climate might be a bad idea.?
(i'm not trying to mock or patronise you – i wouldn't do that, i'm not very good at it)
EdukatorFree MemberPosted 14 years agoOffsetting includes directly generating power. I produce more electricity than I consume, the excess offsets some of the carbon released due to my other activities such as buy bicycle components. If everybody offsets their carbon footprint by investment in alternative energies there will soon be no fossil fuel power stations and enough surplus electricity to make the electric car a less polluting alterantive (electric cars charged with fossil fuel generated electricity make no sense at all).
haineyFree MemberPosted 14 years ago(why do people with little or no interest in any other field of science feel the passion about AGCC? – the world is full of interesting scientific research, why pick this?)
It is a subject very close to a lot of peoples hearts and also gets brought to almost everyones attention via the media. I for one have a great deal of interest in many different fields.
which of the following statements would you disagree with:
1) CO2 is a greenhouse gas.
2) human activity is increasing the amount of CO2 in the atmosphere.
3) tinkering with the climate might be a bad idea.1) – Yes, but its not mutually exclusive, you also need to consider Water vapour alongside it – its not that simple. Also, methane, whilst not as abundant as CO2 is a much worse gas.
2) – Humans are emitting CO2 into the atmosphere.
3) – If humans have the power to tinker with the climate then yes.
(i'm not trying to mock or patronise you – i wouldn't do that, i'm not very good at it)
– thankyou.
JunkyardFree MemberPosted 14 years agoZULU -11 quick googling re your source
Ok so you found one person to evidence your claim and you used a paper that was published, not in a peer reviwed scientific journal but in the economist and the only graph was described thusDr. Mörner was president of the International Union for Quaternary Research’s (INQUA) Commission on Sea-Level Changes and Coastal Evolution (1999-2003). Its research proved that the catastrophic predictions of the Intergovernmental Panel on Climate Change (IPCC), based on computer models of the effects of global warming, are “nonsense.”
That has every conspiracy theory in it and it is clearly hyperbole – you cant like it surely? Please note that In 2004 the president of INQUA wrote that INQUA did not subscribe to Mörner's views on climate change- a group of scientists concluding something was nonsense FFS
He was published in the in the EIR magazine that headline for Coppenhaggen summit saidthey tried nazis at Nuremberg didn't they
Recent articles includes an article on
British Crown Peddles Hitler-Style Genocide- Shocking documentation of the Crown's calls for reducing world population by several billion people in the short term.
or my personal favourite
Since the Copenhagen summit, the British have launched a new global "strategy of tension," ranging from the physical assaults against Italian Prime Minister Silvio Berlusconi and Pope Benedict XVI, to terrorism worldwide.
If you want to cite a reference from that magazine as a refutation of the IPCC report then I wish you all the best convincing anyone of its validity. Very poor source indeed – that was only 10 mins googling to get that.
magazine here
contents here[url=http://www.eirna.com/html/magazine/eirmage.htm]magazine here[/url]
british quote here from bonkers magazinecrankboyFree MemberPosted 14 years agohainey i saw this and i thought of you it's from one of those scientist blokes he studies climate change and weather and stuff. He is a strong believer in man made climate change but The telegraph (Torygraph) and Daily Mail (Daily Hate) keep misrepresenting his research and saying it contradicts man made climate change.
"There are numerous newspapers, radio stations and television channels all trying to get our attention. Some overstate and some want to downplay the problem as a way to get that attention," he said. "We are trying to discuss in the media a highly complex issue. Nobody would discuss the problem of [Einstein's theory of] relativity in the media. But because we all experience the weather, we all believe that we can assess the global warming problem."
Mojib Latif, from Leibniz Institute at Kiel University in Germany.JunkyardFree MemberPosted 14 years agoHainey
As you have accepted that C02 is a greenhouse gas and that humans are emitting it.Were we doing so at the levels now at any time in the distant past ?
EDIT:Do you think that the evidence from the ozone hole suggests that we can tinker with the atmosphere bot in apositive and a negative way.That is CFC created it and by stopping there use the damage was reversed? Man can tinker surely that is a given?haineyFree MemberPosted 14 years agoJunkyard, as humans weren't around thousands of years ago, what was responsible for the CO2 rises then?
What was responsible for the temperature rise preceeding the CO2 increase?
What was responsible for the CO2 level decreasing?
 or
or


The topic ‘It's global cooling, not warming!’ is closed to new replies.