- This topic has 9 replies, 5 voices, and was last updated 8 years ago by fadda.
-
Any R experts/geeks in da house?
-
Welcome! I wonder if anyone can help me on this one…
I’m currently trying to learn R, and am stumped. I want to produce a scatter plot with a power regression line plotted through my data points. Easy-peasy in Excel, I was able to knock up the following in about 30 secs:
Power regression plot by Ginger F0x, on FlickrI can plot the points fine in R, using both the inbuilt plot function and the ggplot2 package. But I can’t find anything online that lets me plot the power regression through the points. I can do linear, loess, polynomial, but that’s not what I’m after. A web search turned up nothing useful…
Any takers? π
Posted 8 years ago
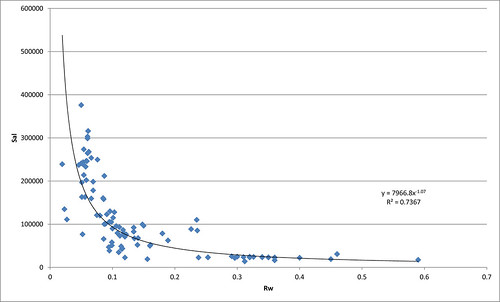
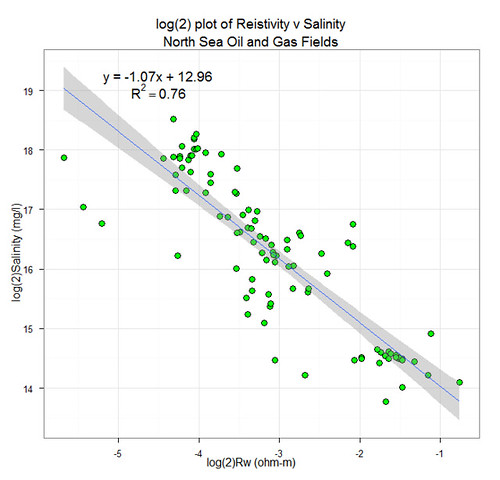
Why don’t you just plot the data as log(Rw) vs. log(Sal) with a linear regression line through the data? Non-linear fitting is fine, but log-log is easier.
y = ax^b so log(y) = log(a) + b log(x)
find b from your regression.
Alternatively, looking at your data, it’s pretty obvious that the product of Sal x Rw is a constant (power is minus unity). So you could also plot 1/Rw vs. Sal. That would give a nice regression line but tell you about the value of a only (because b is fixed to -1).
EDIT: if you STILL want to model the data as is, then I suggest reading this. Personally, I’d log the data. A search on “Non-linear Regression R example” turned this up.
Posted 8 years agoThanks very much, will give those methods a shot!
Posted 8 years agoIf you really want to fit with the power law then you will require the nls function:
ModelFit <- nls(Sal ~ a*Rw^b),
data = YourDataSet,
start = list(a = 8000, b = -1)
)summary(ModelFit)
The log-log fitting will be the best method for the simple case you have. I’m more of a SAS lover, so graphics will require overlaying as plot of the function with obtained parameters a,b. that is left to the interested reader π
Posted 8 years agoOh my god!
People actually do this?!?!
π
Posted 8 years agoWtf!!!
I mastered ABC easy enough, but on the basis of above, I think I’ll leave ‘R’ for a bit….
Posted 8 years ago[video]http://www.youtube.com/watch?v=k0glomgHzv4[/video]
Posted 8 years agoSeeing as you’re all so interested, this is the linear regression of the logs of my data, as djaustin suggested. Good, eh? π
Posted 8 years ago
Salinity Rw plot by Ginger F0x, on FlickrNow try it with nls and not linearizing. It will be good for your R skills but won’t look as nice as the above. And your graphics are miles better than mine!
Posted 8 years agoYou mis-spelt resistivity… π
Posted 8 years ago
The topic ‘Any R experts/geeks in da house?’ is closed to new replies.