- This topic has 31 replies, 19 voices, and was last updated 11 years ago by .
Viewing 32 posts - 1 through 32 (of 32 total)
-
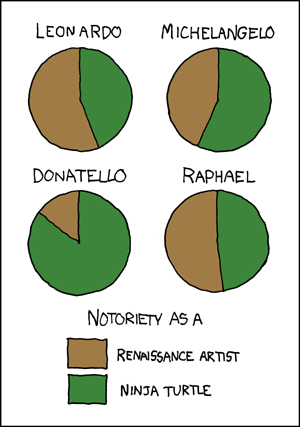
I need some pie charts….
-


Viewing 32 posts - 1 through 32 (of 32 total)
The topic ‘I need some pie charts….’ is closed to new replies.